U.S. Census for Central Florida, 1950
Dublin Core
Title
U.S. Census for Central Florida, 1950
Alternative Title
Census, 1950
Subject
Census--United States
Orange County (Fla.)
Marion County (Fla.)
Brevard County (Fla.)
St. Lucie County (Fla.)
Seminole County (Fla.)
Volusia County (Fla.)
Flagler County (Fla.)
Lake County (Fla.)
Osceola County (Fla.)
Population--United States
Description
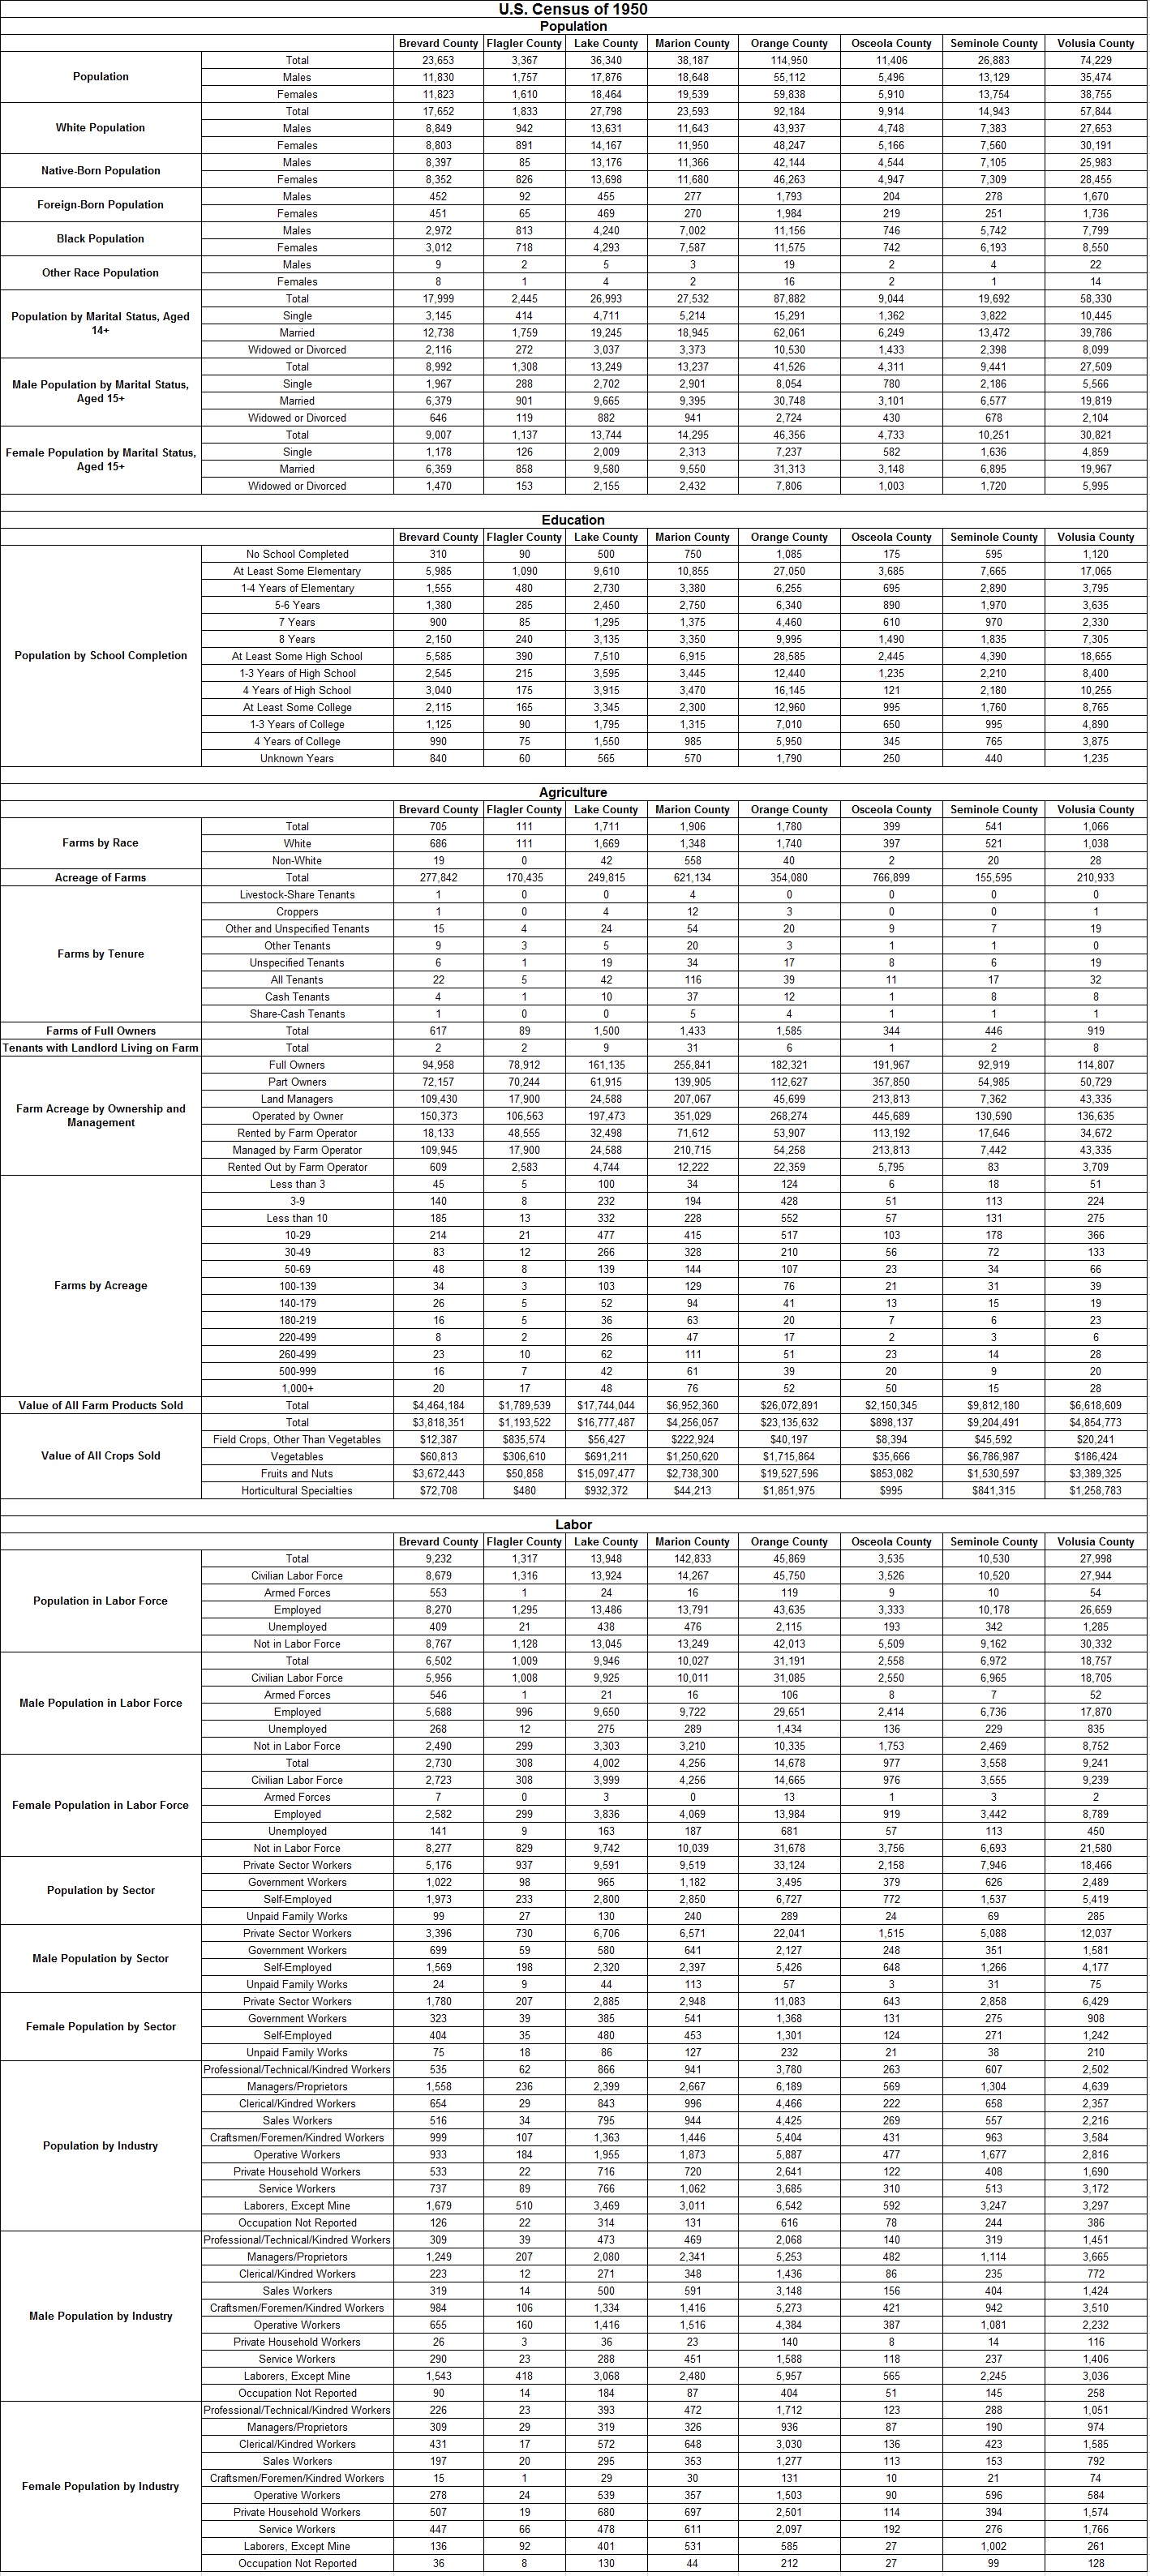
The Seventeenth United States Census records for Brevard County, Flagler County, Lake County, Marion County, Orange County, Osceola County, Seminole County, and Volusia County, Florida, for 1950. The census divides the population by gender, race ("white" and "black"), and native-born vs. foreign-born. The census then lists the population categorized by age, marital status, primary and secondary school attendance, and college attendance. The census also collected information on agriculture, on unemployment, and on labor.
The Census of 1950 encompassed every state, Alaska, Hawaii, American Samoa, the Panama Canal Zone, Guam, Puerto Rico, the Virgin Islands, and other small American territories. For the first time, the U.S. Census Bureau enumerated Americans living abroad to account for members of the Armed Forces, vessel crew members, and government employees residing in foreign countries. The Department of Defense (DOD), the Department of State (DOS), the Maritime Administration (MARAD), and several other federal agencies were responsible for distributing and collecting census questionnaires in a cooperative effort. Persons living abroad for reasons other than what is listed above had their census information reported by families or neighbors residing in the United States, but such data was criticized as unreliable and were not published in official statistics.
The 1950 Census also included a new survey on residential financing collected separately on a sample basis from owners of owner-occupied properties, rental properties, and mortgage lenders. The accuracy of the new census was increased by improved enumerator training, the use of detailed street maps for enumerators, the publication of "Missed Person" forms in local newspapers, and the designation of a specific night to conduct a special enumeration of transient individuals. Moreover, a post-enumeration survey was conducted to further verify the accuracy of the original enumeration. A sample of approximately 3,500 small areas was compared to the original census data to identify households that may have been omitted initially. Likewise, a sample of approximately 22,000 households were re-interviewed to identify persons omitted in the original enumeration count. Though not used for the 1950 Census, the UNIVersal Automatic Computer I (UNIVAC I), the first non-military computer, was used to tabulate some of the statistics for the 1954 census of economy. In August of 1954, Congress codified various census statutes, such as the Fifteenth Census Act of 1929, authorizing the decennial census and other census.
Creator
Source
Original census data collected by the U.S. Census Bureau, 1950.
Publisher
Date Created
ca. 1950-04-01
Contributor
Gibson, Ella
Is Format Of
Digital reproduction of original census data collected by the U.S. Census Bureau, 1950.
Is Part Of
U.S. Census Collection, RICHES of Central Florida.
Format
image/jpg
Extent
1.59 MB
Medium
1 table
Language
eng
Type
Dataset
Coverage
Brevard County, Florida
Flagler County, Florida
Lake County, Florida
Marion County, Florida
Orange County, Florida
Osceola County, Florida
Seminole County, Florida
Volusia County, Florida
Accrual Method
Item Creation
Mediator
History Teacher
Economics Teacher
Civics/Government Teacher
Geography Teacher
Provenance
Originally collected by the U.S. Census Bureau and published by the U.S. Department of Commerce.
Rights Holder
This resource is not subject to copyright in the United States and there are no copyright restrictions on reproduction, derivative works, distribution, performance, or display of the work. Anyone may, without restriction under U.S. copyright laws:
- reproduce the work in print or digital form;
- create derivative works;
- perform the work publicly;
- display the work;
- distribute copies or digitally transfer the work to the public by sale or other transfer of ownership, or by rental, lease, or lending.
Curator
Cepero, Laura
Digital Collection
External Reference
"1950 Overview." U.S. Census Bureau. https://www.census.gov/history/www/through_the_decades/overview/1950.html.
United States. Historical Statistics of the United States: Colonial Times to 1970. Washington: U.S. Dept. of Commerce, Bureau of the Census, 1975. https://www.census.gov/history/pdf/histstats-colonial-1970.pdf.
United States, and Carroll D. Wright. The History and Growth of the United States Census. Washington: U.S. Government Printing Office, 1950. https://www.census.gov/history/pdf/wright-hunt.pdf.
Office of the Assistant Director for Statistical Standards, Statistical Reports Division. The 1950 Censuses How They Were Taken. Washington: U.S. Government Printing Office, 1955.
Transcript
U.S. Census of 1950
Population
Brevard County Flagler County Lake County Marion County Orange County Osceola County Seminole County Volusia County
Population Total 23,653 3,367 36,340 38,187 114,950 11,406 26,883 74,229
Males 11,830 1,757 17,876 18,648 55,112 5,496 13,129 35,474
Females 11,823 1,610 18,464 19,539 59,838 5,910 13,754 38,755
White Population Total 17,652 1,833 27,798 23,593 92,184 9,914 14,943 57,844
Males 8,849 942 13,631 11,643 43,937 4,748 7,383 27,653
Females 8,803 891 14,167 11,950 48,247 5,166 7,560 30,191
Native-Born Population Males 8,397 85 13,176 11,366 42,144 4,544 7,105 25,983
Females 8,352 826 13,698 11,680 46,263 4,947 7,309 28,455
Foreign-Born Population Males 452 92 455 277 1,793 204 278 1,670
Females 451 65 469 270 1,984 219 251 1,736
Black Population Males 2,972 813 4,240 7,002 11,156 746 5,742 7,799
Females 3,012 718 4,293 7,587 11,575 742 6,193 8,550
Other Race Population Males 9 2 5 3 19 2 4 22
Females 8 1 4 2 16 2 1 14
Population by Marital Status, Aged 14+ Total 17,999 2,445 26,993 27,532 87,882 9,044 19,692 58,330
Single 3,145 414 4,711 5,214 15,291 1,362 3,822 10,445
Married 12,738 1,759 19,245 18,945 62,061 6,249 13,472 39,786
Widowed or Divorced 2,116 272 3,037 3,373 10,530 1,433 2,398 8,099
Male Population by Marital Status, Aged 15+ Total 8,992 1,308 13,249 13,237 41,526 4,311 9,441 27,509
Single 1,967 288 2,702 2,901 8,054 780 2,186 5,566
Married 6,379 901 9,665 9,395 30,748 3,101 6,577 19,819
Widowed or Divorced 646 119 882 941 2,724 430 678 2,104
Female Population by Marital Status, Aged 15+ Total 9,007 1,137 13,744 14,295 46,356 4,733 10,251 30,821
Single 1,178 126 2,009 2,313 7,237 582 1,636 4,859
Married 6,359 858 9,580 9,550 31,313 3,148 6,895 19,967
Widowed or Divorced 1,470 153 2,155 2,432 7,806 1,003 1,720 5,995
Education
Brevard County Flagler County Lake County Marion County Orange County Osceola County Seminole County Volusia County
Population by School Completion No School Completed 310 90 500 750 1,085 175 595 1,120
At Least Some Elementary 5,985 1,090 9,610 10,855 27,050 3,685 7,665 17,065
1-4 Years of Elementary 1,555 480 2,730 3,380 6,255 695 2,890 3,795
5-6 Years 1,380 285 2,450 2,750 6,340 890 1,970 3,635
7 Years 900 85 1,295 1,375 4,460 610 970 2,330
8 Years 2,150 240 3,135 3,350 9,995 1,490 1,835 7,305
At Least Some High School 5,585 390 7,510 6,915 28,585 2,445 4,390 18,655
1-3 Years of High School 2,545 215 3,595 3,445 12,440 1,235 2,210 8,400
4 Years of High School 3,040 175 3,915 3,470 16,145 121 2,180 10,255
At Least Some College 2,115 165 3,345 2,300 12,960 995 1,760 8,765
1-3 Years of College 1,125 90 1,795 1,315 7,010 650 995 4,890
4 Years of College 990 75 1,550 985 5,950 345 765 3,875
Unknown Years 840 60 565 570 1,790 250 440 1,235
Agriculture
Brevard County Flagler County Lake County Marion County Orange County Osceola County Seminole County Volusia County
Farms by Race Total 705 111 1,711 1,906 1,780 399 541 1,066
White 686 111 1,669 1,348 1,740 397 521 1,038
Non-White 19 0 42 558 40 2 20 28
Acreage of Farms Total 277,842 170,435 249,815 621,134 354,080 766,899 155,595 210,933
Farms by Tenure Livestock-Share Tenants 1 0 0 4 0 0 0 0
Croppers 1 0 4 12 3 0 0 1
Other and Unspecified Tenants 15 4 24 54 20 9 7 19
Other Tenants 9 3 5 20 3 1 1 0
Unspecified Tenants 6 1 19 34 17 8 6 19
All Tenants 22 5 42 116 39 11 17 32
Cash Tenants 4 1 10 37 12 1 8 8
Share-Cash Tenants 1 0 0 5 4 1 1 1
Farms of Full Owners Total 617 89 1,500 1,433 1,585 344 446 919
Tenants with Landlord Living on Farm Total 2 2 9 31 6 1 2 8
Farm Acreage by Ownership and Management Full Owners 94,958 78,912 161,135 255,841 182,321 191,967 92,919 114,807
Part Owners 72,157 70,244 61,915 139,905 112,627 357,850 54,985 50,729
Land Managers 109,430 17,900 24,588 207,067 45,699 213,813 7,362 43,335
Operated by Owner 150,373 106,563 197,473 351,029 268,274 445,689 130,590 136,635
Rented by Farm Operator 18,133 48,555 32,498 71,612 53,907 113,192 17,646 34,672
Managed by Farm Operator 109,945 17,900 24,588 210,715 54,258 213,813 7,442 43,335
Rented Out by Farm Operator 609 2,583 4,744 12,222 22,359 5,795 83 3,709
Farms by Acreage Less than 3 45 5 100 34 124 6 18 51
3-9 140 8 232 194 428 51 113 224
Less than 10 185 13 332 228 552 57 131 275
10-29 214 21 477 415 517 103 178 366
30-49 83 12 266 328 210 56 72 133
50-69 48 8 139 144 107 23 34 66
100-139 34 3 103 129 76 21 31 39
140-179 26 5 52 94 41 13 15 19
180-219 16 5 36 63 20 7 6 23
220-499 8 2 26 47 17 2 3 6
260-499 23 10 62 111 51 23 14 28
500-999 16 7 42 61 39 20 9 20
1,000+ 20 17 48 76 52 50 15 28
Value of All Farm Products Sold Total $4,464,184 $1,789,539 $17,744,044 $6,952,360 $26,072,891 $2,150,345 $9,812,180 $6,618,609
Value of All Crops Sold Total $3,818,351 $1,193,522 $16,777,487 $4,256,057 $23,135,632 $898,137 $9,204,491 $4,854,773
Field Crops, Other Than Vegetables $12,387 $835,574 $56,427 $222,924 $40,197 $8,394 $45,592 $20,241
Vegetables $60,813 $306,610 $691,211 $1,250,620 $1,715,864 $35,666 $6,786,987 $186,424
Fruits and Nuts $3,672,443 $50,858 $15,097,477 $2,738,300 $19,527,596 $853,082 $1,530,597 $3,389,325
Horticultural Specialties $72,708 $480 $932,372 $44,213 $1,851,975 $995 $841,315 $1,258,783
Labor
Population in Labor Force Total 9,232 1,317 13,948 142,833 45,869 3,535 10,530 27,998
Civilian Labor Force 8,679 1,316 13,924 14,267 45,750 3,526 10,520 27,944
Armed Forces 553 1 24 16 119 9 10 54
Employed 8,270 1,295 13,486 13,791 43,635 3,333 10,178 26,659
Unemployed 409 21 438 476 2,115 193 342 1,285
Not in Labor Force 8,767 1,128 13,045 13,249 42,013 5,509 9,162 30,332
Male Population in Labor Force Total 6,502 1,009 9,946 10,027 31,191 2,558 6,972 18,757
Civilian Labor Force 5,956 1,008 9,925 10,011 31,085 2,550 6,965 18,705
Armed Forces 546 1 21 16 106 8 7 52
Employed 5,688 996 9,650 9,722 29,651 2,414 6,736 17,870
Unemployed 268 12 275 289 1,434 136 229 835
Not in Labor Force 2,490 299 3,303 3,210 10,335 1,753 2,469 8,752
Female Population in Labor Force Total 2,730 308 4,002 4,256 14,678 977 3,558 9,241
Civilian Labor Force 2,723 308 3,999 4,256 14,665 976 3,555 9,239
Armed Forces 7 0 3 0 13 1 3 2
Employed 2,582 299 3,836 4,069 13,984 919 3,442 8,789
Unemployed 141 9 163 187 681 57 113 450
Not in Labor Force 8,277 829 9,742 10,039 31,678 3,756 6,693 21,580
Population by Sector Private Sector Workers 5,176 937 9,591 9,519 33,124 2,158 7,946 18,466
Government Workers 1,022 98 965 1,182 3,495 379 626 2,489
Self-Employed 1,973 233 2,800 2,850 6,727 772 1,537 5,419
Unpaid Family Works 99 27 130 240 289 24 69 285
Male Population by Sector Private Sector Workers 3,396 730 6,706 6,571 22,041 1,515 5,088 12,037
Government Workers 699 59 580 641 2,127 248 351 1,581
Self-Employed 1,569 198 2,320 2,397 5,426 648 1,266 4,177
Unpaid Family Works 24 9 44 113 57 3 31 75
Female Population by Sector Private Sector Workers 1,780 207 2,885 2,948 11,083 643 2,858 6,429
Government Workers 323 39 385 541 1,368 131 275 908
Self-Employed 404 35 480 453 1,301 124 271 1,242
Unpaid Family Works 75 18 86 127 232 21 38 210
Population by Industry Professional/Technical/Kindred Workers 535 62 866 941 3,780 263 607 2,502
Managers/Proprietors 1,558 236 2,399 2,667 6,189 569 1,304 4,639
Clerical/Kindred Workers 654 29 843 996 4,466 222 658 2,357
Sales Workers 516 34 795 944 4,425 269 557 2,216
Craftsmen/Foremen/Kindred Workers 999 107 1,363 1,446 5,404 431 963 3,584
Operative Workers 933 184 1,955 1,873 5,887 477 1,677 2,816
Private Household Workers 533 22 716 720 2,641 122 408 1,690
Service Workers 737 89 766 1,062 3,685 310 513 3,172
Laborers, Except Mine 1,679 510 3,469 3,011 6,542 592 3,247 3,297
Occupation Not Reported 126 22 314 131 616 78 244 386
Male Population by Industry Professional/Technical/Kindred Workers 309 39 473 469 2,068 140 319 1,451
Managers/Proprietors 1,249 207 2,080 2,341 5,253 482 1,114 3,665
Clerical/Kindred Workers 223 12 271 348 1,436 86 235 772
Sales Workers 319 14 500 591 3,148 156 404 1,424
Craftsmen/Foremen/Kindred Workers 984 106 1,334 1,416 5,273 421 942 3,510
Operative Workers 655 160 1,416 1,516 4,384 387 1,081 2,232
Private Household Workers 26 3 36 23 140 8 14 116
Service Workers 290 23 288 451 1,588 118 237 1,406
Laborers, Except Mine 1,543 418 3,068 2,480 5,957 565 2,245 3,036
Occupation Not Reported 90 14 184 87 404 51 145 258
Female Population by Industry Professional/Technical/Kindred Workers 226 23 393 472 1,712 123 288 1,051
Managers/Proprietors 309 29 319 326 936 87 190 974
Clerical/Kindred Workers 431 17 572 648 3,030 136 423 1,585
Sales Workers 197 20 295 353 1,277 113 153 792
Craftsmen/Foremen/Kindred Workers 15 1 29 30 131 10 21 74
Operative Workers 278 24 539 357 1,503 90 596 584
Private Household Workers 507 19 680 697 2,501 114 394 1,574
Service Workers 447 66 478 611 2,097 192 276 1,766
Laborers, Except Mine 136 92 401 531 585 27 1,002 261
Occupation Not Reported 36 8 130 44 212 27 99 128
Document Item Type Metadata
Original Format
1 table
Collection
Citation
U.S. Census Bureau, “U.S. Census for Central Florida, 1950,” RICHES, accessed July 15, 2026, https://richesmi.cah.ucf.edu/omeka/items/show/3841.