U.S. Census for Central Florida, 1960
Dublin Core
Title
U.S. Census for Central Florida, 1960
Alternative Title
Census, 1960
Subject
Census--United States
Orange County (Fla.)
Marion County (Fla.)
Brevard County (Fla.)
St. Lucie County (Fla.)
Seminole County (Fla.)
Volusia County (Fla.)
Flagler County (Fla.)
Lake County (Fla.)
Osceola County (Fla.)
Population--United States
Description
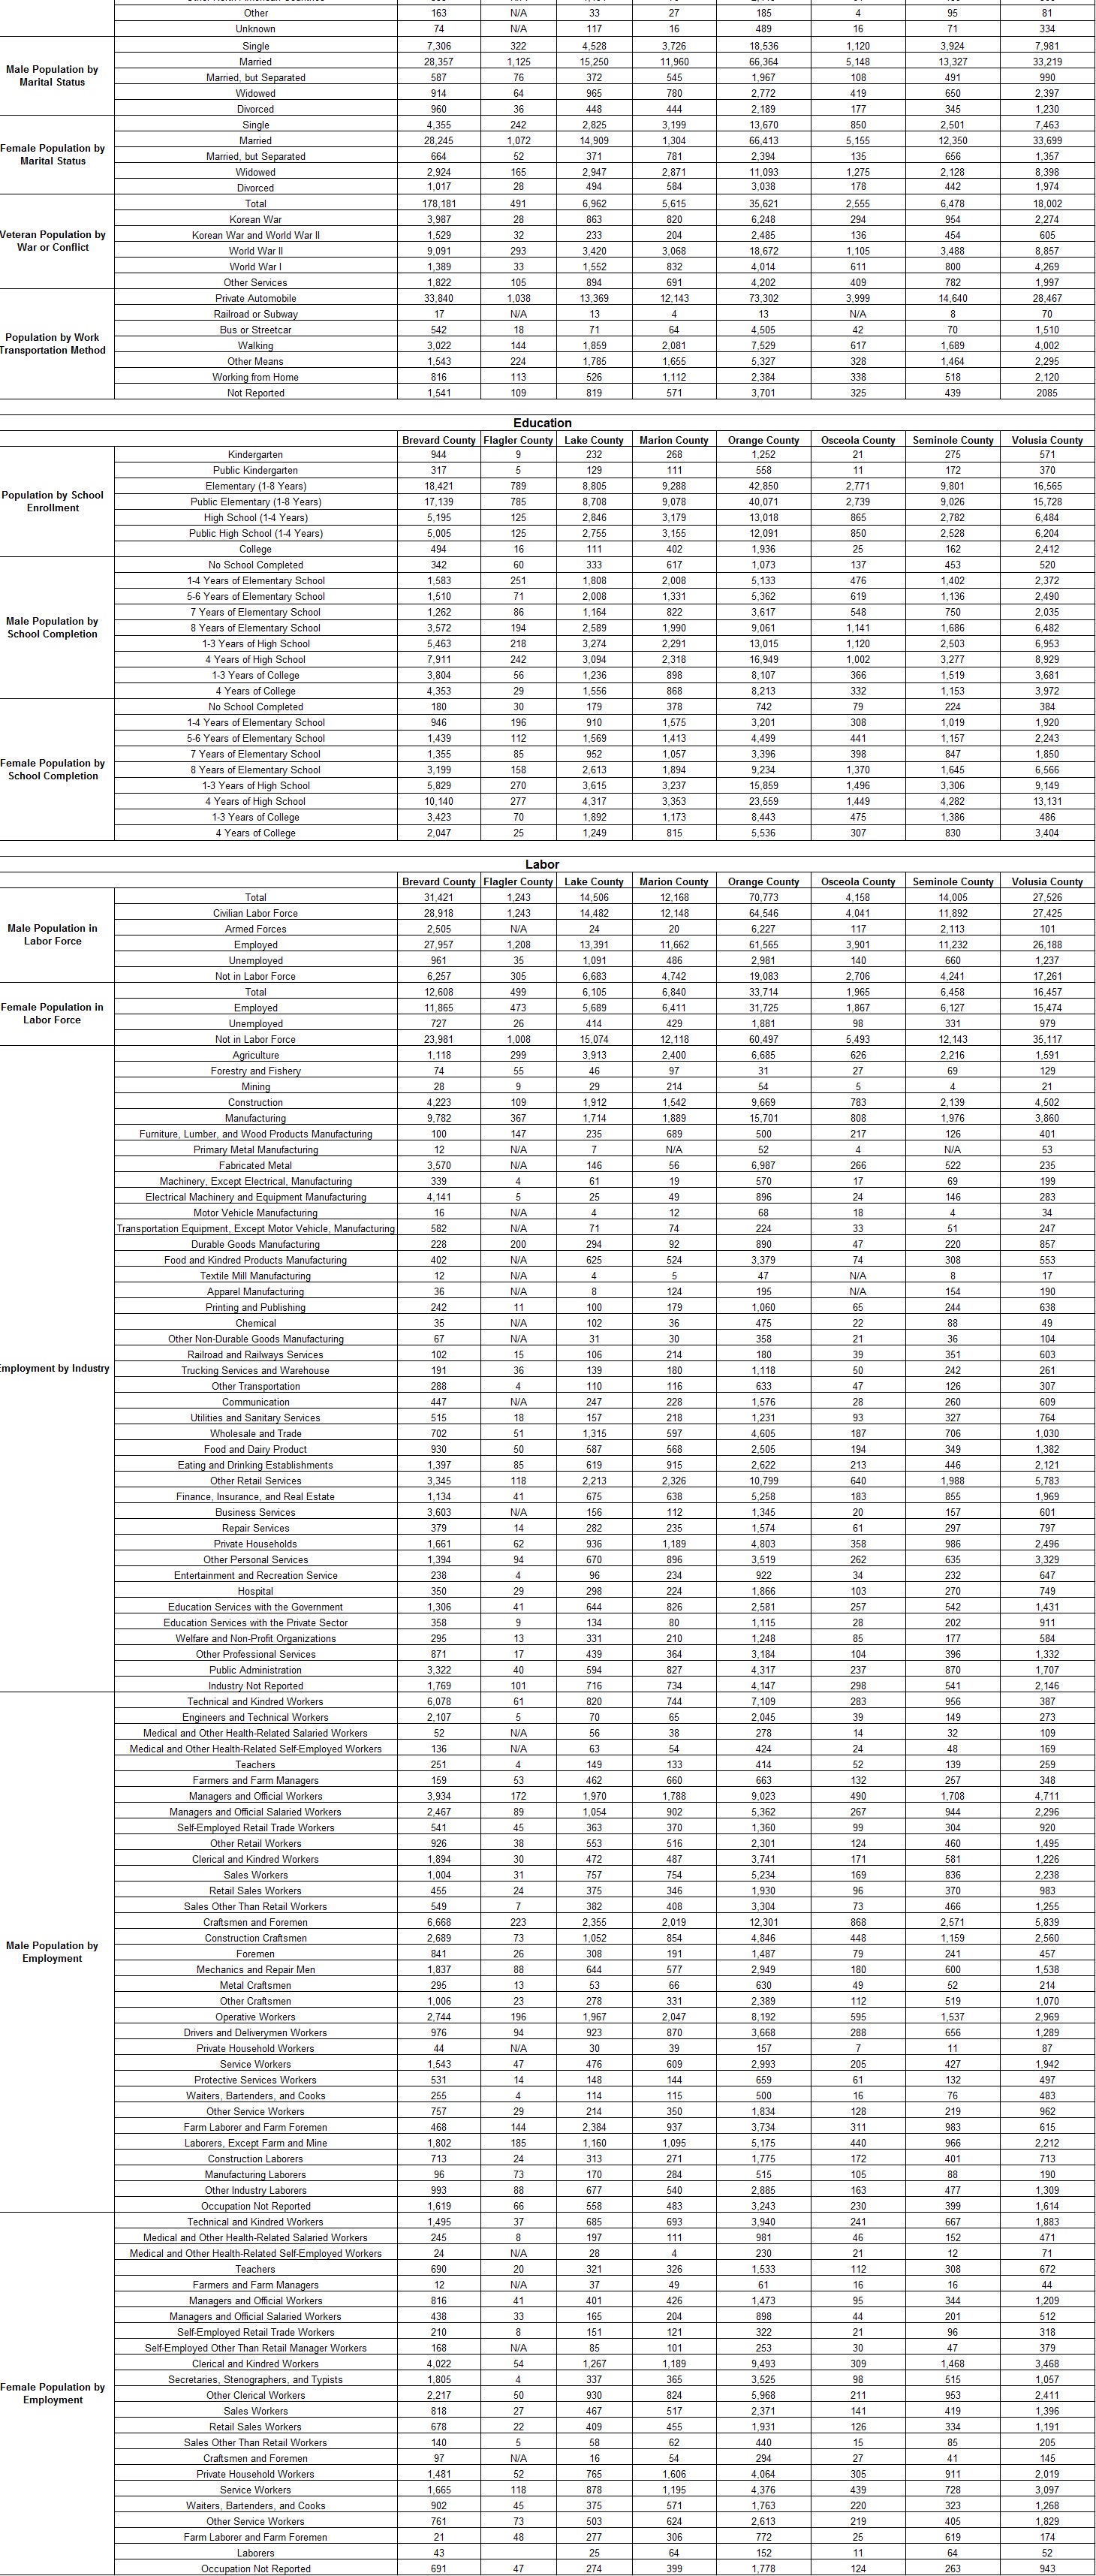
The Eighteenth United States Census records for Brevard County, Flagler County, Lake County, Marion County, Orange County, Osceola County, Seminole County, and Volusia County, Florida, for 1960. The census divides the population by gender, race ("white", "black", "Japanese", "Chinese", "Filipino", and "other"), and native-born vs. foreign-born. Those who are foreign born are further divided by country of origin. The census then lists the population categorized by age, military service, transportation use, primary and secondary school attendance, and college attendance. The census also collected information on labor and on unemployment.
The Census of 1960 was the first to be mailed to respondents. The U.S. Post Office Department delivered census questionnaires to households, the head of household was required to complete the questionnaire, and an enumerator was to pick it up. The enumeration process was divided into two stages: first, select data for each person and dwelling unit was collected; and second, more detailed economic and social data was collected from a sample of households and dwelling units. The census questionnaires for the second stage were hand-delivered by enumerators as they were collecting data from the first stage. Households receiving the second census questionnaire were to complete the form and mail it to their local census office. Twenty-five percent of the population was giving additional sample questions. Because of the increased use of sampling, less populated areas were prone to sampling variation; however, this did not significantly decrease the usefulness of census statistics gathered. Moreover, increased use of sampling reduced data processing costs. Additional questions included in the 1960 Census were related to places of work and means of transportation to work. By 1960, nearly all census data was processed using computers. The U.S. Census Bureau used a Film Optical Sensing Device for Input to Computer (FOSDIC) for the first time, thus decreasing the amount of time and money required for data input.
The Census of 1960 was the first to be mailed to respondents. The U.S. Post Office Department delivered census questionnaires to households, the head of household was required to complete the questionnaire, and an enumerator was to pick it up. The enumeration process was divided into two stages: first, select data for each person and dwelling unit was collected; and second, more detailed economic and social data was collected from a sample of households and dwelling units. The census questionnaires for the second stage were hand-delivered by enumerators as they were collecting data from the first stage. Households receiving the second census questionnaire were to complete the form and mail it to their local census office. Twenty-five percent of the population was giving additional sample questions. Because of the increased use of sampling, less populated areas were prone to sampling variation; however, this did not significantly decrease the usefulness of census statistics gathered. Moreover, increased use of sampling reduced data processing costs. Additional questions included in the 1960 Census were related to places of work and means of transportation to work. By 1960, nearly all census data was processed using computers. The U.S. Census Bureau used a Film Optical Sensing Device for Input to Computer (FOSDIC) for the first time, thus decreasing the amount of time and money required for data input.
Creator
Source
Original census data collected by the U.S. Census Bureau, 1960.
Publisher
Date Created
ca. 1960-04-01
Contributor
Gibson, Ella
Is Format Of
Digital reproduction of original census data collected by the U.S. Census Bureau, 1960.
Is Part Of
U.S. Census Collection, RICHES of Central Florida.
Format
image/jpg
Extent
1.75 MB
Medium
1 table
Language
eng
Type
Dataset
Coverage
Brevard County, Florida
Flagler County, Florida
Lake County, Florida
Marion County, Florida
Orange County, Florida
Osceola County, Florida
Seminole County, Florida
Volusia County, Florida
Accrual Method
Item Creation
Mediator
History Teacher
Economics Teacher
Civics/Government Teacher
Geography Teacher
Provenance
Originally collected by the U.S. Census Bureau and published by the U.S. Department of Commerce.
Rights Holder
This resource is not subject to copyright in the United States and there are no copyright restrictions on reproduction, derivative works, distribution, performance, or display of the work. Anyone may, without restriction under U.S. copyright laws:
- reproduce the work in print or digital form;
- create derivative works;
- perform the work publicly;
- display the work;
- distribute copies or digitally transfer the work to the public by sale or other transfer of ownership, or by rental, lease, or lending.
Curator
Cepero, Laura
Digital Collection
Source Repository
External Reference
"1960 Overview." U.S. Census Bureau. https://www.census.gov/history/www/through_the_decades/overview/1960.html.
United States. Historical Statistics of the United States: Colonial Times to 1970. Washington: U.S. Dept. of Commerce, Bureau of the Census, 1975. https://www.census.gov/history/pdf/histstats-colonial-1970.pdf.
United States, and Carroll D. Wright. The History and Growth of the United States Census. Washington: U.S. Government Printing Office, 1970. https://www.census.gov/history/pdf/wright-hunt.pdf.
U.S. Bureau of the Census. 1960 Censuses of Population and Housing: Procedural History. Washington: U.S. Government Printing Office, 1966.
Transcript
U.S. Census of 1960
Population
Brevard County Flagler County Lake County Marion County Orange County Osceola County Seminole County Volusia County
Population Total 111,435 4,566 57,383 51,616 263,540 19,029 54,947 125,319
Males 56,724 2,297 28,893 24,940 129,843 9,237 27,495 59,635
Females 54,711 2,269 28,490 26,676 133,697 9,792 27,452 65,684
White Population Total 98,909 2,826 46,209 33,586 224,105 17,021 41,373 104,177
Males 50,286 1,406 22,691 16,535 109,757 8,239 20,900 49,530
Females 48,623 1,420 23,518 17,051 114,348 8,782 20,473 54,647
Black Population Total 12,334 1,733 11,122 18,001 39,088 1,977 13,500 21,048
Males 6,348 887 6,173 8,392 19,924 982 6,559 10,053
Females 5,986 846 4,949 9,609 19,164 995 6,941 10,995
Indian Population Total 78 2 34 16 89 21 3 24
Males 49 1 18 7 46 11 2 13
Females 29 1 16 9 43 10 1 11
Japanese Population Total 52 0 6 8 102 4 34 13
Males 11 0 2 2 42 2 14 5
Females 41 0 4 6 60 2 20 8
Chinese Population Total 14 0 0 0 60 0 0 19
Males 10 0 0 0 25 0 0 14
Females 4 0 0 0 35 0 0 5
Filipino Population Total 13 4 0 0 35 4 15 6
Males 5 2 0 0 14 2 9 3
Females 8 2 0 0 21 2 6 3
Other Race Population Total 35 1 12 5 61 2 22 32
Males 15 1 9 4 35 1 11 17
Females 20 0 3 1 26 1 11 15
Native-Born Population Total 11,374 N/A 5,825 2,751 27,317 2,065 4,391 20,186
Foreign-Born Population Total 100,061 N/A 51,558 48,865 236,223 16,964 50,556 105,133
Foreign-Born Population by Country of Origin United Kingdom 1,810 N/A 924 314 4,390 434 728 4,106
Irish Free State 414 N/A 171 97 845 96 113 1,010
Norway 164 N/A 113 20 444 34 59 290
Sweden 440 N/A 274 110 984 114 168 883
Denmark 158 N/A 75 33 321 28 66 259
Netherlands 147 N/A 77 32 381 26 74 253
Switzerland 103 N/A 87 52 287 29 48 215
France 295 N/A 109 83 543 63 78 430
Germany 1,969 N/A 981 516 4,214 460 737 3,566
Poland 433 N/A 157 390 1,125 58 183 634
Czechoslovakia 392 N/A 109 27 632 18 217 256
Austria 297 N/A 86 102 721 40 104 604
Hungary 197 N/A 74 48 577 33 70 415
Yugoslavia 73 N/A 31 21 222 28 31 201
USSR 275 N/A 77 63 931 13 98 555
Lithuania 118 N/A 12 61 154 4 30 120
Finland 88 N/A 55 4 166 9 66 129
Rumania 29 N/A 11 4 151 4 12 92
Greece 135 N/A 28 36 221 4 71 216
Italy 983 N/A 264 149 1,814 70 299 1,178
Portugal 57 N/A 4 4 43 0 12 74
Other European Countries 181 N/A 50 52 382 8 83 318
Asia 217 N/A 21 46 726 7 70 279
Canada 1,583 N/A 665 365 4,087 400 665 3,147
Mexico 46 N/A 26 0 167 4 4 33
Other North American Countries 533 N/A 1,194 79 2,115 61 139 508
Other 163 N/A 33 27 185 4 95 81
Unknown 74 N/A 117 16 489 16 71 334
Male Population by Marital Status Single 7,306 322 4,528 3,726 18,536 1,120 3,924 7,981
Married 28,357 1,125 15,250 11,960 66,364 5,148 13,327 33,219
Married, but Separated 587 76 372 545 1,967 108 491 990
Widowed 914 64 965 780 2,772 419 650 2,397
Divorced 960 36 448 444 2,189 177 345 1,230
Female Population by Marital Status Single 4,355 242 2,825 3,199 13,670 850 2,501 7,463
Married 28,245 1,072 14,909 1,304 66,413 5,155 12,350 33,699
Married, but Separated 664 52 371 781 2,394 135 656 1,357
Widowed 2,924 165 2,947 2,871 11,093 1,275 2,128 8,398
Divorced 1,017 28 494 584 3,038 178 442 1,974
Veteran Population by War or Conflict Total 178,181 491 6,962 5,615 35,621 2,555 6,478 18,002
Korean War 3,987 28 863 820 6,248 294 954 2,274
Korean War and World War II 1,529 32 233 204 2,485 136 454 605
World War II 9,091 293 3,420 3,068 18,672 1,105 3,488 8,857
World War I 1,389 33 1,552 832 4,014 611 800 4,269
Other Services 1,822 105 894 691 4,202 409 782 1,997
Population by Work Transportation Method Private Automobile 33,840 1,038 13,369 12,143 73,302 3,999 14,640 28,467
Railroad or Subway 17 N/A 13 4 13 N/A 8 70
Bus or Streetcar 542 18 71 64 4,505 42 70 1,510
Walking 3,022 144 1,859 2,081 7,529 617 1,689 4,002
Other Means 1,543 224 1,785 1,655 5,327 328 1,464 2,295
Working from Home 816 113 526 1,112 2,384 338 518 2,120
Not Reported 1,541 109 819 571 3,701 325 439 2085
Education
Brevard County Flagler County Lake County Marion County Orange County Osceola County Seminole County Volusia County
Population by School Enrollment Kindergarten 944 9 232 268 1,252 21 275 571
Public Kindergarten 317 5 129 111 558 11 172 370
Elementary (1-8 Years) 18,421 789 8,805 9,288 42,850 2,771 9,801 16,565
Public Elementary (1-8 Years) 17,139 785 8,708 9,078 40,071 2,739 9,026 15,728
High School (1-4 Years) 5,195 125 2,846 3,179 13,018 865 2,782 6,484
Public High School (1-4 Years) 5,005 125 2,755 3,155 12,091 850 2,528 6,204
College 494 16 111 402 1,936 25 162 2,412
Male Population by School Completion No School Completed 342 60 333 617 1,073 137 453 520
1-4 Years of Elementary School 1,583 251 1,808 2,008 5,133 476 1,402 2,372
5-6 Years of Elementary School 1,510 71 2,008 1,331 5,362 619 1,136 2,490
7 Years of Elementary School 1,262 86 1,164 822 3,617 548 750 2,035
8 Years of Elementary School 3,572 194 2,589 1,990 9,061 1,141 1,686 6,482
1-3 Years of High School 5,463 218 3,274 2,291 13,015 1,120 2,503 6,953
4 Years of High School 7,911 242 3,094 2,318 16,949 1,002 3,277 8,929
1-3 Years of College 3,804 56 1,236 898 8,107 366 1,519 3,681
4 Years of College 4,353 29 1,556 868 8,213 332 1,153 3,972
Female Population by School Completion No School Completed 180 30 179 378 742 79 224 384
1-4 Years of Elementary School 946 196 910 1,575 3,201 308 1,019 1,920
5-6 Years of Elementary School 1,439 112 1,569 1,413 4,499 441 1,157 2,243
7 Years of Elementary School 1,355 85 952 1,057 3,396 398 847 1,850
8 Years of Elementary School 3,199 158 2,613 1,894 9,234 1,370 1,645 6,566
1-3 Years of High School 5,829 270 3,615 3,237 15,859 1,496 3,306 9,149
4 Years of High School 10,140 277 4,317 3,353 23,559 1,449 4,282 13,131
1-3 Years of College 3,423 70 1,892 1,173 8,443 475 1,386 486
4 Years of College 2,047 25 1,249 815 5,536 307 830 3,404
Labor
Brevard County Flagler County Lake County Marion County Orange County Osceola County Seminole County Volusia County
Male Population in Labor Force Total 31,421 1,243 14,506 12,168 70,773 4,158 14,005 27,526
Civilian Labor Force 28,918 1,243 14,482 12,148 64,546 4,041 11,892 27,425
Armed Forces 2,505 N/A 24 20 6,227 117 2,113 101
Employed 27,957 1,208 13,391 11,662 61,565 3,901 11,232 26,188
Unemployed 961 35 1,091 486 2,981 140 660 1,237
Not in Labor Force 6,257 305 6,683 4,742 19,083 2,706 4,241 17,261
Female Population in Labor Force Total 12,608 499 6,105 6,840 33,714 1,965 6,458 16,457
Employed 11,865 473 5,689 6,411 31,725 1,867 6,127 15,474
Unemployed 727 26 414 429 1,881 98 331 979
Not in Labor Force 23,981 1,008 15,074 12,118 60,497 5,493 12,143 35,117
Employment by Industry Agriculture 1,118 299 3,913 2,400 6,685 626 2,216 1,591
Forestry and Fishery 74 55 46 97 31 27 69 129
Mining 28 9 29 214 54 5 4 21
Construction 4,223 109 1,912 1,542 9,669 783 2,139 4,502
Manufacturing 9,782 367 1,714 1,889 15,701 808 1,976 3,860
Furniture, Lumber, and Wood Products Manufacturing 100 147 235 689 500 217 126 401
Primary Metal Manufacturing 12 N/A 7 N/A 52 4 N/A 53
Fabricated Metal 3,570 N/A 146 56 6,987 266 522 235
Machinery, Except Electrical, Manufacturing 339 4 61 19 570 17 69 199
Electrical Machinery and Equipment Manufacturing 4,141 5 25 49 896 24 146 283
Motor Vehicle Manufacturing 16 N/A 4 12 68 18 4 34
Transportation Equipment, Except Motor Vehicle, Manufacturing 582 N/A 71 74 224 33 51 247
Durable Goods Manufacturing 228 200 294 92 890 47 220 857
Food and Kindred Products Manufacturing 402 N/A 625 524 3,379 74 308 553
Textile Mill Manufacturing 12 N/A 4 5 47 N/A 8 17
Apparel Manufacturing 36 N/A 8 124 195 N/A 154 190
Printing and Publishing 242 11 100 179 1,060 65 244 638
Chemical 35 N/A 102 36 475 22 88 49
Other Non-Durable Goods Manufacturing 67 N/A 31 30 358 21 36 104
Railroad and Railways Services 102 15 106 214 180 39 351 603
Trucking Services and Warehouse 191 36 139 180 1,118 50 242 261
Other Transportation 288 4 110 116 633 47 126 307
Communication 447 N/A 247 228 1,576 28 260 609
Utilities and Sanitary Services 515 18 157 218 1,231 93 327 764
Wholesale and Trade 702 51 1,315 597 4,605 187 706 1,030
Food and Dairy Product 930 50 587 568 2,505 194 349 1,382
Eating and Drinking Establishments 1,397 85 619 915 2,622 213 446 2,121
Other Retail Services 3,345 118 2,213 2,326 10,799 640 1,988 5,783
Finance, Insurance, and Real Estate 1,134 41 675 638 5,258 183 855 1,969
Business Services 3,603 N/A 156 112 1,345 20 157 601
Repair Services 379 14 282 235 1,574 61 297 797
Private Households 1,661 62 936 1,189 4,803 358 986 2,496
Other Personal Services 1,394 94 670 896 3,519 262 635 3,329
Entertainment and Recreation Service 238 4 96 234 922 34 232 647
Hospital 350 29 298 224 1,866 103 270 749
Education Services with the Government 1,306 41 644 826 2,581 257 542 1,431
Education Services with the Private Sector 358 9 134 80 1,115 28 202 911
Welfare and Non-Profit Organizations 295 13 331 210 1,248 85 177 584
Other Professional Services 871 17 439 364 3,184 104 396 1,332
Public Administration 3,322 40 594 827 4,317 237 870 1,707
Industry Not Reported 1,769 101 716 734 4,147 298 541 2,146
Male Population by Employment Technical and Kindred Workers 6,078 61 820 744 7,109 283 956 387
Engineers and Technical Workers 2,107 5 70 65 2,045 39 149 273
Medical and Other Health-Related Salaried Workers 52 N/A 56 38 278 14 32 109
Medical and Other Health-Related Self-Employed Workers 136 N/A 63 54 424 24 48 169
Teachers 251 4 149 133 414 52 139 259
Farmers and Farm Managers 159 53 462 660 663 132 257 348
Managers and Official Workers 3,934 172 1,970 1,788 9,023 490 1,708 4,711
Managers and Official Salaried Workers 2,467 89 1,054 902 5,362 267 944 2,296
Self-Employed Retail Trade Workers 541 45 363 370 1,360 99 304 920
Other Retail Workers 926 38 553 516 2,301 124 460 1,495
Clerical and Kindred Workers 1,894 30 472 487 3,741 171 581 1,226
Sales Workers 1,004 31 757 754 5,234 169 836 2,238
Retail Sales Workers 455 24 375 346 1,930 96 370 983
Sales Other Than Retail Workers 549 7 382 408 3,304 73 466 1,255
Craftsmen and Foremen 6,668 223 2,355 2,019 12,301 868 2,571 5,839
Construction Craftsmen 2,689 73 1,052 854 4,846 448 1,159 2,560
Foremen 841 26 308 191 1,487 79 241 457
Mechanics and Repair Men 1,837 88 644 577 2,949 180 600 1,538
Metal Craftsmen 295 13 53 66 630 49 52 214
Other Craftsmen 1,006 23 278 331 2,389 112 519 1,070
Operative Workers 2,744 196 1,967 2,047 8,192 595 1,537 2,969
Drivers and Deliverymen Workers 976 94 923 870 3,668 288 656 1,289
Private Household Workers 44 N/A 30 39 157 7 11 87
Service Workers 1,543 47 476 609 2,993 205 427 1,942
Protective Services Workers 531 14 148 144 659 61 132 497
Waiters, Bartenders, and Cooks 255 4 114 115 500 16 76 483
Other Service Workers 757 29 214 350 1,834 128 219 962
Farm Laborer and Farm Foremen 468 144 2,384 937 3,734 311 983 615
Laborers, Except Farm and Mine 1,802 185 1,160 1,095 5,175 440 966 2,212
Construction Laborers 713 24 313 271 1,775 172 401 713
Manufacturing Laborers 96 73 170 284 515 105 88 190
Other Industry Laborers 993 88 677 540 2,885 163 477 1,309
Occupation Not Reported 1,619 66 558 483 3,243 230 399 1,614
Female Population by Employment Technical and Kindred Workers 1,495 37 685 693 3,940 241 667 1,883
Medical and Other Health-Related Salaried Workers 245 8 197 111 981 46 152 471
Medical and Other Health-Related Self-Employed Workers 24 N/A 28 4 230 21 12 71
Teachers 690 20 321 326 1,533 112 308 672
Farmers and Farm Managers 12 N/A 37 49 61 16 16 44
Managers and Official Workers 816 41 401 426 1,473 95 344 1,209
Managers and Official Salaried Workers 438 33 165 204 898 44 201 512
Self-Employed Retail Trade Workers 210 8 151 121 322 21 96 318
Self-Employed Other Than Retail Manager Workers 168 N/A 85 101 253 30 47 379
Clerical and Kindred Workers 4,022 54 1,267 1,189 9,493 309 1,468 3,468
Secretaries, Stenographers, and Typists 1,805 4 337 365 3,525 98 515 1,057
Other Clerical Workers 2,217 50 930 824 5,968 211 953 2,411
Sales Workers 818 27 467 517 2,371 141 419 1,396
Retail Sales Workers 678 22 409 455 1,931 126 334 1,191
Sales Other Than Retail Workers 140 5 58 62 440 15 85 205
Craftsmen and Foremen 97 N/A 16 54 294 27 41 145
Private Household Workers 1,481 52 765 1,606 4,064 305 911 2,019
Service Workers 1,665 118 878 1,195 4,376 439 728 3,097
Waiters, Bartenders, and Cooks 902 45 375 571 1,763 220 323 1,268
Other Service Workers 761 73 503 624 2,613 219 405 1,829
Farm Laborer and Farm Foremen 21 48 277 306 772 25 619 174
Laborers 43 25 64 152 11 64 52
Occupation Not Reported 691 47 274 399 1,778 124 263 943
Document Item Type Metadata
Original Format
1 table
Collection
Citation
U.S. Census Bureau, “U.S. Census for Central Florida, 1960,” RICHES, accessed July 17, 2026, https://richesmi.cah.ucf.edu/omeka/items/show/3842.