U.S. Census for Central Florida, 1970
Dublin Core
Title
U.S. Census for Central Florida, 1970
Alternative Title
Census, 1970
Subject
Census--United States
Orange County (Fla.)
Marion County (Fla.)
Brevard County (Fla.)
St. Lucie County (Fla.)
Seminole County (Fla.)
Volusia County (Fla.)
Flagler County (Fla.)
Lake County (Fla.)
Osceola County (Fla.)
Population--United States
Description
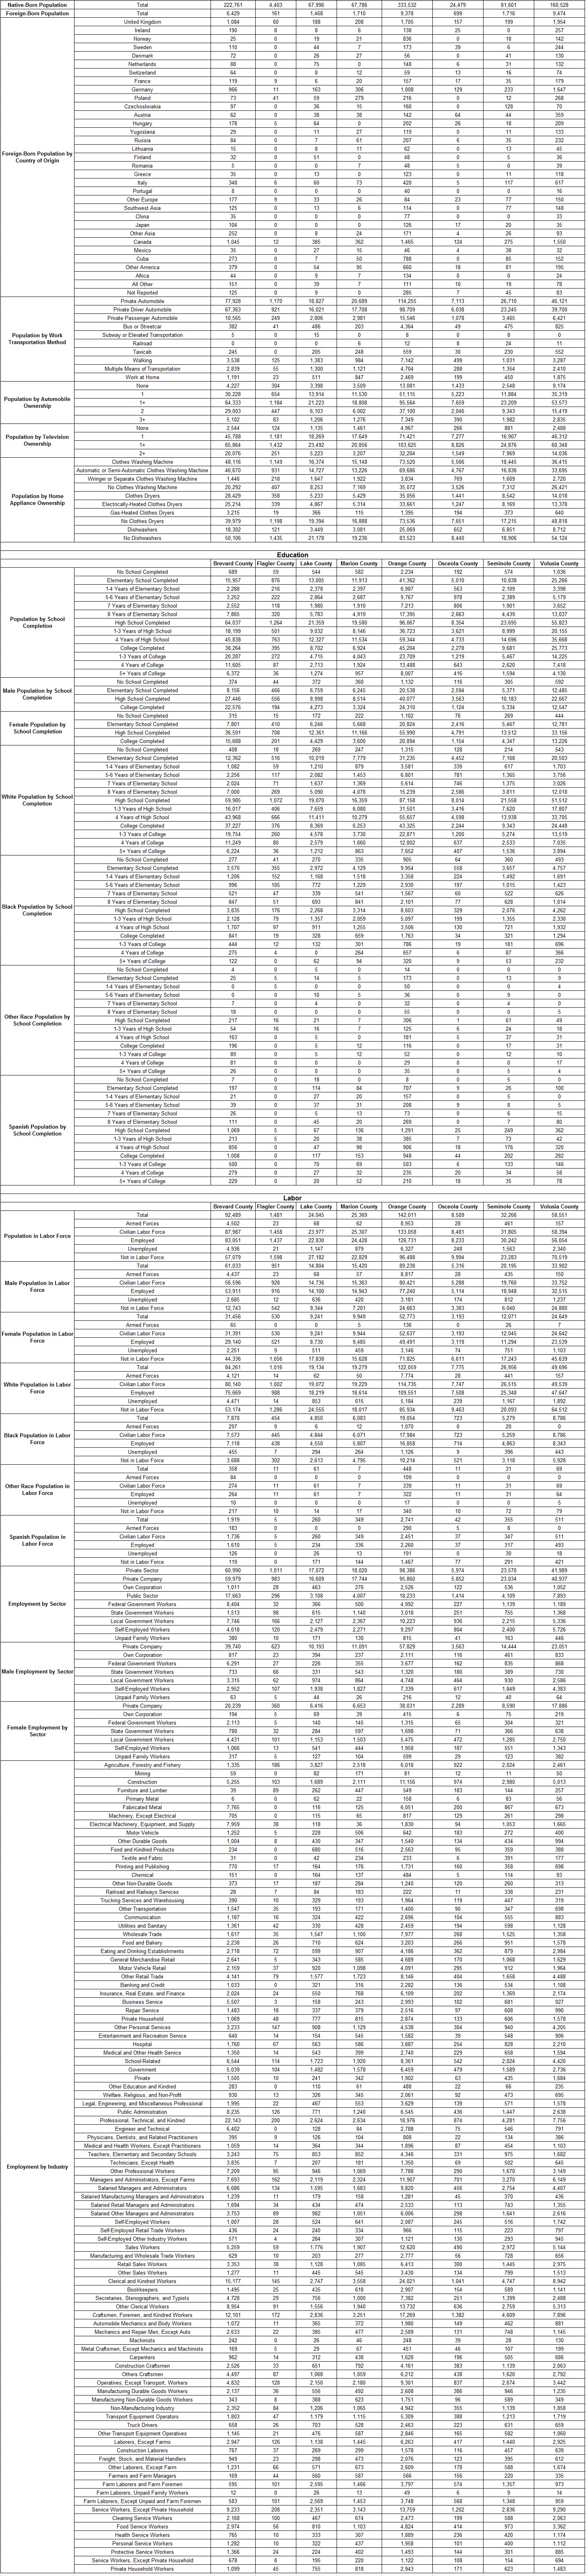
The Nineteenth United States Census records for Brevard County, Flagler County, Lake County, Marion County, Orange County, Osceola County, Seminole County, and Volusia County, Florida, for 1970. The census divides the population by gender, race ("white," "black," "Spanish," and "other"), and native-born vs. foreign-born. Those who are foreign born are further divided by country of origin. The census then lists the population categorized by marital status, type of residence, military service, primary and secondary school attendance, and college attendance. The census also collected information on labor, on unemployment, on transportation, and on ownership of various types of technology.
In 1966, the U.S. Census Bureau sought suggestions from advisory committees and from the public, resulting in numerous proposals for additional inquiries related to the scope and structure of the census, as well as in public interest for the publication of additional census data. Researchers also concluded that the 1950 Census and the 1960 Census had undercounted certain segments of the population. Moreover, they noted a growing distrust of government activity and increased resistance to responding to the census. Simultaneously, both the public and private sectors expressed need for accurate information. The U.S. Census Bureau decreased its number of questions from 66 to 23 in an effort to simplify its products. A register for densely populated areas was also created to ensure that all housing units were accounted for. A Spanish-language questionnaire was also enclosed with census questionnaires in areas with a significant amount of Spanish-speaking households. Additionally, a question on Hispanic origins or descent was asked independently from race, but only on a five-percent sample. Only five questions were given to all individuals: relationship to household head, sex, race, age, and marital status. Additional questions were asked in smaller sample groups. This was also the first census in which respondents of urban areas were asked to mail their forms to the Census Bureau, rather than to hold questionnaires for enumerators.
Address Coding Guides were used to assign census geographic codes to questionnaires. Counts, a series of computer tape files, was an additional innovation used to increase the accuracy of census data. Count 1 consisted of complete count data for block groups and/or enumeration districts. Count 2 contained census tracts and minor civil/census county divisions, while Count 3 consisted of census blocks. Counts 4-6 provided sample census data for geographic areas of various population sizes. The Census Bureau also produced six Public Use Microdata Sample files, each of which contained complete information for a sample of approximately two million people. Finally, the Census Bureau developed the Summary Tape Processing Center Program, which was a group of organizations, both public and private, that processed census data from computer tapes.
Creator
Source
Original census data collected by the U.S. Census Bureau, 1970.
Publisher
Date Created
ca. 1970-04-01
Contributor
Gibson, Ella
Is Format Of
Digital reproduction of original census data collected by the U.S. Census Bureau, 1970.
Is Part Of
U.S. Census Collection, RICHES of Central Florida.
Format
image/jpg
Extent
2.23 MB
Medium
1 table
Language
eng
Type
Dataset
Coverage
Brevard County, Florida
Flagler County, Florida
Lake County, Florida
Marion County, Florida
Orange County, Florida
Osceola County, Florida
Seminole County, Florida
Volusia County, Florida
Accrual Method
Item Creation
Mediator
History Teacher
Economics Teacher
Civics/Government Teacher
Geography Teacher
Provenance
Originally collected by the U.S. Census Bureau and published by the U.S. Department of Commerce.
Rights Holder
This resource is not subject to copyright in the United States and there are no copyright restrictions on reproduction, derivative works, distribution, performance, or display of the work. Anyone may, without restriction under U.S. copyright laws:
- reproduce the work in print or digital form;
- create derivative works;
- perform the work publicly;
- display the work;
- distribute copies or digitally transfer the work to the public by sale or other transfer of ownership, or by rental, lease, or lending.
Curator
Cepero, Laura
Digital Collection
Source Repository
External Reference
"1970 Overview." U.S. Census Bureau. https://www.census.gov/history/www/through_the_decades/overview/1970.html.
United States. Historical Statistics of the United States: Colonial Times to 1970. Washington: U.S. Dept. of Commerce, Bureau of the Census, 1975. https://www.census.gov/history/pdf/histstats-colonial-1970.pdf.
United States, and Carroll D. Wright. The History and Growth of the United States Census. Washington: U.S. Government Printing Office, 1970. https://www.census.gov/history/pdf/wright-hunt.pdf.
U.S. Bureau of the Census. Procedural History: 1970 Census of Population and Housing. Washington: U.S. Government Printing Office, 1966.
Transcript
U.S. Census of 1970
Population
Brevard County Flagler County Lake County Marion County Orange County Osceola County Seminole County Volusia County
Population Total 230,006 4,454 69,305 69,030 344,311 25,267 83,692 169,487
Males 115,184 2,211 33,350 33,005 167,980 12,095 40,605 79,328
Females 114,822 2,243 35,955 36,025 176,331 13,172 43,087 90,159
Population by Race White 208,436 3,068 57,104 50,914 294,653 23,098 69,582 145,320
Black 20,664 1,365 12,056 18,060 48,593 2,148 13,977 23,984
Other Race 906 21 145 56 1,065 21 133 183
Population by Descent or Origin Spanish Descent or Origin 5,100 5 761 875 6,940 194 1,012 1,304
Not Spanish Descent or Origin 224,900 4,449 68,544 68,155 337,371 25,073 82,680 168,183
Households Occupied 68,560 1,488 24,621 22,317 108,645 9,092 25,757 62,747
Husband-Wife Families 51,151 949 16,866 15,104 75,525 6,055 19,194 39,510
Other Family Units 7,069 193 2,478 2,768 12,589 1,005 2,619 7,300
Family Units with Male Head 1,731 71 619 729 2,294 229 468 1,417
Family Units with Female Head 5,338 122 1,859 2,039 10,295 776 2,151 5,883
Male Primary Individual Household Units 5,028 168 1,862 1,676 7,213 677 1,420 5,035
Female Primary Individual Household Units 5,312 178 3,415 2,769 13,318 1,355 2,524 10,902
Population in Group Quarters Total 3,250 77 1,163 1,394 10,655 391 446 4,972
Institutionalized People 289 7 800 1,157 2,669 239 267 1,519
Inmates of Mental Hospitals 0 0 0 6 38 0 0 17
Inmates of Homes for the Aged and Dependent 231 0 582 147 1,063 119 245 957
Inmates of Other Institutions 58 7 218 1,004 1,568 120 22 545
Population Not Institutionalized 2,961 70 363 237 7,986 152 179 3,453
Rooming Houses 209 23 175 83 346 32 99 663
Military Barracks 1,824 0 0 0 5,534 0 4 7
College Dormitories 682 0 24 26 1,276 0 0 2,327
Other Group Quarters 246 47 164 128 830 90 76 456
Population by Marital Status Never Married 35,563 735 9,597 10,702 59,514 3,295 12,091 26,855
Married 108,282 2,018 35,798 32,303 158,034 12,957 39,775 83,513
Spouse Present 104,133 1,924 34,419 30,832 153,144 12,550 38,847 80,356
Spouse Absent 4,149 94 1,379 1,471 4,890 407 928 3,157
Separated 2,627 127 1,115 1,460 5,710 384 1,580 2,539
Widowed 7,930 328 5,694 4,822 19,390 2,226 4,149 16,508
Divorced 5,779 78 1,713 1,766 10,333 677 1,752 5,682
Veteran Population by War or Conflict Vietnam Conflict 5,998 16 1,020 1,470 10,602 470 2,556 3,358
Korean War 8,513 125 1,264 1,384 3,522 521 1,957 3,259
Korean War and World War II 2,589 11 278 335 3,764 186 1,083 960
World War II 13,782 334 4,177 4,181 20,725 1,354 4,576 10,861
World War I 984 45 1,623 793 2,873 583 691 4,307
Other Services 5,916 18 1,060 1,505 6,359 493 1,769 3,172
Non-Veterans 31,721 919 14,626 12,902 52,302 5,056 13,199 32,679
Native-Born Population Total 222,761 4,403 67,996 67,786 333,532 24,479 81,601 160,528
Foreign-Born Population Total 6,429 161 1,468 1,710 9,378 699 1,716 9,474
Foreign-Born Population by Country of Origin United Kingdom 1,084 60 188 208 1,705 157 199 1,954
Ireland 190 8 8 6 138 25 0 257
Norway 25 0 19 21 836 0 18 142
Sweden 110 0 44 7 173 39 6 244
Denmark 72 0 26 27 56 0 41 130
Netherlands 88 0 75 0 148 6 31 132
Switzerland 64 0 8 12 59 13 16 74
France 119 9 6 20 157 17 35 179
Germany 966 11 163 306 1,008 129 233 1,647
Poland 73 41 59 279 216 0 12 268
Czechoslovakia 97 0 36 15 160 0 128 70
Austria 62 0 38 38 142 64 44 359
Hungary 178 5 64 0 202 26 18 209
Yugoslavia 29 0 11 27 119 0 11 133
Russia 84 0 7 61 207 6 35 232
Lithuania 15 0 8 11 62 0 13 45
Finland 32 0 51 0 48 0 5 36
Romania 5 0 0 7 48 5 0 39
Greece 35 0 13 0 123 0 11 118
Italy 348 6 60 73 420 5 117 617
Portugal 8 0 0 0 40 0 0 16
Other Europe 177 9 33 26 84 23 77 150
Southwest Asia 125 0 13 6 114 0 77 148
China 35 0 0 0 77 0 0 33
Japan 104 0 0 0 126 17 20 35
Other Asia 252 0 8 24 171 4 26 93
Canada 1,045 12 385 362 1,465 124 275 1,550
Mexico 35 0 27 15 46 4 38 32
Cuba 273 0 7 50 788 0 85 152
Other America 379 0 54 95 660 18 81 195
Africa 44 0 9 7 134 0 0 24
All Other 151 0 39 7 111 10 19 78
Not Reported 125 0 9 0 285 7 45 83
Population by Work Transportation Method Private Automobile 77,928 1,170 18,827 20,689 114,255 7,113 26,710 46,121
Private Driver Automobile 67,363 921 16,021 17,708 98,709 6,038 23,245 39,700
Private Passenger Automobile 10,565 249 2,806 2,981 15,546 1,078 3,465 6,421
Bus or Streetcar 382 41 486 203 4,364 49 475 825
Subway or Elevated Transportation 5 0 15 0 8 0 8 0
Railroad 0 0 0 6 12 8 24 11
Taxicab 245 0 205 248 559 30 230 552
Walking 3,538 125 1,383 984 7,142 499 1,031 3,287
Multiple Means of Transportation 2,839 55 1,300 1,121 4,704 288 1,354 2,410
Work at Home 1,191 23 511 847 2,469 199 450 1,875
Population by Automobile Ownership None 4,227 304 3,398 3,509 13,081 1,433 2,548 9,174
1 30,228 654 13,914 11,530 51,115 5,223 11,884 35,319
1+ 64,333 1,184 21,223 18,808 95,564 7,659 23,209 53,573
2 29,003 447 6,103 6,002 37,100 2,046 9,343 15,419
3+ 5,102 83 1,206 1,276 7,349 390 1,982 2,835
Population by Television Ownership None 2,544 124 1,135 1,461 4,967 266 881 2,488
1 45,788 1,181 18,269 17,649 71,421 7,277 16,907 46,312
1+ 65,864 1,432 23,492 20,856 103,625 8,826 24,876 60,348
2+ 20,076 251 5,223 3,207 32,204 1,549 7,969 14,036
Population by Home Appliance Ownership Clothes Washing Machine 48,116 1,149 16,374 15,148 73,520 5,566 18,445 36,415
Automatic or Semi-Automatic Clothes Washing Machine 46,670 931 14,727 13,226 69,686 4,767 16,836 33,695
Wringer or Separate Clothes Washing Machine 1,446 218 1,647 1,922 3,834 769 1,609 2,720
No Clothes Washing Machine 20,292 407 8,253 7,169 35,072 3,526 7,312 26,421
Clothes Dryers 28,429 358 5,233 5,429 35,056 1,441 8,542 14,018
Electrically-Heated Clothes Dryers 25,214 339 4,867 5,314 33,661 1,247 8,169 13,378
Gas-Heated Clothes Dryers 3,215 19 366 115 1,395 194 373 640
No Clothes Dryers 39,979 1,198 19,394 16,888 73,536 7,651 17,215 48,818
Dishwashers 18,302 121 3,449 3,081 25,069 652 6,851 8,712
No Dishwashers 50,106 1,435 21,178 19,236 83,523 8,440 18,906 54,124
Education
Brevard County Flagler County Lake County Marion County Orange County Osceola County Seminole County Volusia County
Population by School Completion No School Completed 689 59 544 582 2,234 192 574 1,036
Elementary School Completed 15,957 876 13,005 11,913 41,362 5,010 10,838 25,266
1-4 Years of Elementary School 2,288 216 2,378 2,397 6,987 563 2,109 3,398
5-6 Years of Elementary School 3,252 222 2,864 2,687 9,767 978 2,389 5,179
7 Years of Elementary School 2,552 118 1,980 1,910 7,213 806 1,901 3,652
8 Years of Elementary School 7,865 320 5,783 4,919 17,395 2,663 4,439 13,037
High School Completed 64,037 1,264 21,359 19,580 96,067 8,354 23,695 55,823
1-3 Years of High School 18,199 501 9,032 8,146 36,723 3,621 8,999 20,155
4 Years of High School 45,838 763 12,327 11,534 59,344 4,733 14,696 35,668
College Completed 38,264 395 8,702 6,924 45,204 2,278 9,681 25,773
1-3 Years of College 20,287 272 4,715 4,043 23,709 1,219 5,467 14,225
4 Years of College 11,605 87 2,713 1,924 13,488 643 2,620 7,418
5+ Years of College 6,372 36 1,274 957 8,007 416 1,594 4,130
Male Population by School Completion No School Completed 374 44 372 360 1,132 116 305 592
Elementary School Completed 8,156 466 6,759 6,245 20,538 2,594 5,371 12,485
High School Completed 27,446 556 8,998 8,514 40,077 3,563 10,183 22,667
College Completed 22,576 194 4,273 3,324 24,310 1,124 5,334 12,547
Female Population by School Completion No School Completed 315 15 172 222 1,102 76 269 444
Elementary School Completed 7,801 410 6,246 5,668 20,824 2,416 5,467 12,781
High School Completed 36,591 708 12,361 11,166 55,990 4,791 13,512 33,156
College Completed 15,688 201 4,429 3,600 20,894 1,154 4,347 13,226
White Population by School Completion No School Completed 408 18 269 247 1,315 128 214 543
Elementary School Completed 12,362 516 10,019 7,779 31,235 4,452 7,168 20,503
1-4 Years of Elementary School 1,082 59 1,210 879 3,581 339 617 1,703
5-6 Years of Elementary School 2,256 117 2,082 1,453 6,801 781 1,365 3,756
7 Years of Elementary School 2,024 71 1,637 1,369 5,614 746 1,375 3,026
8 Years of Elementary School 7,000 269 5,090 4,078 15,239 2,586 3,811 12,018
High School Completed 59,985 1,072 19,070 16,359 87,158 8,014 21,558 51,512
1-3 Years of High School 16,017 406 7,659 6,080 31,501 3,416 7,620 17,807
4 Years of High School 43,968 666 11,411 10,279 55,657 4,598 13,938 33,705
College Completed 37,227 376 8,369 6,253 43,325 2,244 9,343 24,448
1-3 Years of College 19,754 260 4,578 3,730 22,871 1,200 5,274 13,519
4 Years of College 11,249 80 2,579 1,660 12,802 637 2,533 7,035
5+ Years of College 6,224 36 1,212 863 7,652 407 1,536 3,894
Black Population by School Completion No School Completed 277 41 270 335 905 64 360 493
Elementary School Completed 3,570 355 2,972 4,129 9,954 558 3,657 4,757
1-4 Years of Elementary School 1,206 152 1,168 1,518 3,358 224 1,492 1,691
5-6 Years of Elementary School 996 105 772 1,229 2,930 197 1,015 1,423
7 Years of Elementary School 521 47 339 541 1,567 60 522 626
8 Years of Elementary School 847 51 693 841 2,101 77 628 1,014
High School Completed 3,835 176 2,268 3,314 8,603 329 2,076 4,262
1-3 Years of High School 2,128 79 1,357 2,059 5,097 199 1,355 2,330
4 Years of High School 1,707 97 911 1,255 3,506 130 721 1,932
College Completed 841 19 328 659 1,763 34 321 1,294
1-3 Years of College 444 12 132 301 786 19 181 696
4 Years of College 275 4 0 264 657 6 87 366
5+ Years of College 122 0 62 94 320 9 53 232
Other Race Population by School Completion No School Completed 4 0 5 0 14 0 0 0
Elementary School Completed 25 5 14 5 173 0 13 9
1-4 Years of Elementary School 0 5 0 0 50 0 0 4
5-6 Years of Elementary School 0 0 10 5 36 0 9 0
7 Years of Elementary School 7 0 4 0 32 0 4 0
8 Years of Elementary School 18 0 0 0 55 0 0 5
High School Completed 217 16 21 7 306 1 61 49
1-3 Years of High School 54 16 16 7 125 6 24 18
4 Years of High School 163 0 5 0 181 5 37 31
College Completed 196 0 5 12 116 0 17 31
1-3 Years of College 89 0 5 12 52 0 12 10
4 Years of College 81 0 0 0 29 0 0 17
5+ Years of College 26 0 0 0 35 0 5 4
Spanish Population by School Completion No School Completed 7 0 18 0 8 0 5 0
Elementary School Completed 197 0 114 84 707 9 26 100
1-4 Years of Elementary School 21 0 27 20 157 0 5 0
5-6 Years of Elementary School 39 0 37 31 208 9 8 5
7 Years of Elementary School 26 0 5 13 73 0 6 15
8 Years of Elementary School 111 0 45 20 269 0 7 80
High School Completed 1,069 5 67 136 1,291 25 249 362
1-3 Years of High School 213 5 20 38 385 7 73 42
4 Years of High School 856 0 47 98 906 18 176 320
College Completed 1,008 0 117 153 948 44 202 282
1-3 Years of College 500 0 70 69 503 6 133 146
4 Years of College 279 0 27 32 235 20 34 58
5+ Years of College 229 0 20 52 210 18 35 78
Labor
Brevard County Flagler County Lake County Marion County Orange County Osceola County Seminole County Volusia County
Population in Labor Force Total 92,489 1,481 24,045 25,369 142,011 8,509 32,266 58,551
Armed Forces 4,502 23 68 62 8,953 28 461 157
Civilian Labor Force 87,987 1,458 23,977 25,307 133,058 8,481 31,805 58,394
Employed 83,051 1,437 22,830 24,428 126,731 8,233 30,242 56,054
Unemployed 4,936 21 1,147 879 6,327 248 1,563 2,340
Not in Labor Force 57,079 1,598 27,182 22,829 96,488 9,994 23,283 70,519
Male Population in Labor Force Total 61,033 951 14,804 15,420 89,238 5,316 20,195 33,902
Armed Forces 4,437 23 68 57 8,817 28 435 150
Civilian Labor Force 56,596 928 14,736 15,363 80,421 5,288 19,760 33,752
Employed 53,911 916 14,100 14,943 77,240 5,114 18,948 32,515
Unemployed 2,685 12 636 420 3,181 174 812 1,237
Not in Labor Force 12,743 542 9,344 7,201 24,663 3,383 6,040 24,880
Female Population in Labor Force Total 31,456 530 9,241 9,949 52,773 3,193 12,071 24,649
Armed Forces 65 0 0 5 136 0 26 7
Civilian Labor Force 31,391 530 9,241 9,944 52,637 3,193 12,045 24,642
Employed 29,140 521 8,730 9,485 49,491 3,119 11,294 23,539
Unemployed 2,251 9 511 459 3,146 74 751 1,103
Not in Labor Force 44,336 1,056 17,838 15,628 71,825 6,611 17,243 45,639
White Population in Labor Force Total 84,261 1,016 19,134 19,279 122,059 7,775 26,956 49,696
Armed Forces 4,121 14 62 50 7,774 28 441 157
Civilian Labor Force 80,140 1,002 19,072 19,229 114,735 7,747 26,515 49,539
Employed 75,669 988 18,219 18,614 109,551 7,508 25,348 47,647
Unemployed 4,471 14 853 615 5,184 239 1,167 1,892
Not in Labor Force 53,174 1,286 24,555 18,017 85,934 9,463 20,093 64,512
Black Population in Labor Force Total 7,870 454 4,850 6,083 19,054 723 5,279 8,786
Armed Forces 297 9 6 12 1,070 0 20 0
Civilian Labor Force 7,573 445 4,844 6,071 17,984 723 5,259 8,786
Employed 7,118 438 4,550 5,807 16,858 714 4,863 8,343
Unemployed 455 7 294 264 1,126 9 396 443
Not in Labor Force 3,688 302 2,613 4,795 10,214 521 3,118 5,928
Other Race Population in Labor Force Total 358 11 61 7 448 11 31 69
Armed Forces 84 0 0 0 109 0 0 0
Civilian Labor Force 274 11 61 7 339 11 31 69
Employed 264 11 61 7 322 11 31 64
Unemployed 10 0 0 0 17 0 0 5
Not in Labor Force 217 10 14 17 340 10 72 79
Spanish Population in Labor Force Total 1,919 5 260 349 2,741 42 355 511
Armed Forces 183 0 0 0 290 5 8 0
Civilian Labor Force 1,736 5 260 349 2,451 37 347 511
Employed 1,610 5 234 336 2,260 37 317 493
Unemployed 126 0 26 13 191 0 30 18
Not in Labor Force 119 0 171 144 1,467 77 291 421
Employment by Sector Private Sector 60,990 1,011 17,072 18,020 98,386 5,974 23,570 41,989
Private Company 59,979 983 16,609 17,744 95,860 5,852 23,034 40,937
Own Corporation 1,011 28 463 276 2,526 122 536 1,052
Public Sector 17,663 296 3,108 4,007 18,233 1,414 4,109 7,893
Federal Government Workers 8,404 32 366 500 4,992 227 1,139 1,189
State Government Workers 1,513 98 615 1,140 3,018 251 755 1,368
Local Government Workers 7,746 166 2,127 2,367 10,223 936 2,215 5,336
Self-Employed Workers 4,018 120 2,479 2,271 9,297 804 2,400 5,726
Unpaid Family Workers 380 10 171 130 815 41 163 446
Male Employment by Sector Private Company 39,740 623 10,193 11,091 57,829 3,563 14,444 23,051
Own Corporation 817 23 394 237 2,111 116 461 833
Federal Government Workers 6,291 27 226 355 3,677 162 835 868
State Government Workers 733 66 331 543 1,320 180 389 730
Local Government Workers 3,315 62 974 864 4,748 464 930 2,586
Self-Employed Workers 2,952 107 1,938 1,827 7,339 617 1,849 4,383
Unpaid Family Workers 63 5 44 26 216 12 40 64
Female Employment by Sector Private Company 20,239 360 6,416 6,653 38,031 2,289 8,590 17,886
Own Corporation 194 5 69 39 415 6 75 219
Federal Government Workers 2,113 5 140 145 1,315 65 304 321
State Government Workers 780 32 284 597 1,698 71 366 638
Local Government Workers 4,431 101 1,153 1,503 5,475 472 1,285 2,750
Self-Employed Workers 1,066 13 541 444 1,958 187 551 1,343
Unpaid Family Workers 317 5 127 104 599 29 123 382
Employment by Industry Agriculture, Forestry and Fishery 1,335 186 3,827 2,518 6,018 922 2,024 2,461
Mining 59 0 82 171 81 12 11 50
Construction 5,255 103 1,689 2,111 11,156 974 2,980 5,013
Furniture and Lumber 39 89 262 447 549 183 144 257
Primary Metal 6 0 62 22 158 6 83 56
Fabricated Metal 7,765 0 116 125 6,051 200 867 673
Machinery, Except Electrical 705 0 115 65 817 129 261 298
Electrical Machinery, Equipment, and Supply 7,959 38 118 36 1,830 94 1,053 1,665
Motor Vehicle 1,252 5 228 506 642 183 272 400
Other Durable Goods 1,004 8 430 347 1,540 134 434 994
Food and Kindred Products 234 0 680 516 2,563 95 359 388
Textile and Fabric 31 0 42 234 233 6 391 177
Printing and Publishing 770 17 164 176 1,731 160 358 698
Chemical 151 0 164 137 484 5 114 93
Other Non-Durable Goods 373 17 187 284 1,240 120 260 313
Railroad and Railways Services 28 7 84 183 222 11 338 231
Trucking Services and Warehousing 390 10 329 193 1,964 119 447 319
Other Transportation 1,547 35 193 171 1,400 90 347 698
Communication 1,187 16 324 422 2,696 104 555 883
Utilities and Sanitary 1,361 42 330 428 2,459 194 598 1,128
Wholesale Trade 1,617 35 1,547 1,100 7,977 268 1,525 1,358
Food and Bakery 2,238 26 710 624 3,203 266 951 1,578
Eating and Drinking Establishments 2,718 72 599 907 4,186 362 879 2,984
General Merchandise Retail 2,641 5 343 585 4,689 170 1,068 1,629
Motor Vehicle Retail 2,159 37 920 1,098 4,091 295 912 1,964
Other Retail Trade 4,141 79 1,577 1,723 8,146 404 1,658 4,488
Banking and Credit 1,033 0 321 316 2,282 136 534 1,108
Insurance, Real Estate, and Finance 2,024 24 550 768 6,109 202 1,369 2,174
Business Service 5,507 3 158 243 2,993 102 681 927
Repair Service 1,483 18 337 379 2,516 97 608 990
Private Household 1,069 48 777 815 2,874 133 606 1,578
Other Personal Services 3,233 147 908 1,129 4,538 304 940 4,205
Entertainment and Recreation Service 640 14 154 545 1,582 39 548 906
Hospital 1,760 67 563 586 3,887 254 828 2,210
Medical and Other Health Service 1,350 14 543 399 2,740 229 658 1,594
School-Related 6,544 114 1,723 1,920 8,361 542 2,024 4,420
Government 5,039 104 1,482 1,578 6,459 479 1,589 2,736
Private 1,505 10 241 342 1,902 63 435 1,684
Other Education and Kindred 283 0 110 61 488 22 66 235
Welfare, Religious, and Non-Profit 930 13 326 345 2,061 92 473 695
Legal, Engineering, and Miscellaneous Professional 1,995 22 467 553 3,629 139 571 1,578
Public Administration 8,235 126 771 1,240 6,545 436 1,447 2,638
Professional, Technical, and Kindred 22,143 200 2,624 2,634 18,976 874 4,281 7,756
Engineer and Technical 6,402 0 128 84 2,788 75 546 791
Physicians, Dentists, and Related Practitioners 395 9 126 104 808 22 134 386
Medical and Health Workers, Except Practitioners 1,059 14 364 344 1,896 87 454 1,103
Teachers, Elementary and Secondary Schools 3,243 75 853 852 4,346 331 975 1,682
Technicians, Except Health 3,835 7 207 181 1,350 69 502 645
Other Professional Workers 7,209 95 946 1,069 7,788 290 1,670 3,149
Managers and Administrators, Except Farms 7,693 162 2,119 2,324 11,907 701 3,270 6,149
Salaried Managers and Administrators 6,686 134 1,595 1,683 9,820 456 2,754 4,407
Salaried Manufacturing Managers and Administrators 1,239 11 179 158 1,281 45 370 436
Salaried Retail Managers and Administrators 1,694 34 434 474 2,533 113 743 1,355
Salaried Other Managers and Administrators 3,753 89 982 1,051 6,006 298 1,641 2,616
Self-Employed Workers 1,007 28 524 641 2,087 245 516 1,742
Self-Employed Retail Trade Workers 436 24 240 334 966 115 223 797
Self-Employed Other Industry Workers 571 4 284 307 1,121 130 293 945
Sales Workers 5,259 59 1,776 1,907 12,620 490 2,972 5,144
Manufacturing and Wholesale Trade Workers 629 10 203 277 2,777 56 728 656
Retail Sales Workers 3,353 38 1,128 1,085 6,413 300 1,445 2,975
Other Sales Workers 1,277 11 445 545 3,430 134 799 1,513
Clerical and Kindred Workers 15,177 145 2,747 3,558 24,021 1,041 4,747 8,942
Bookkeepers 1,495 25 435 618 2,907 154 589 1,141
Secretaries, Stenographers, and Typists 4,728 29 756 1,000 7,382 251 1,399 2,488
Other Clerical Workers 8,954 91 1,556 1,940 13,732 636 2,759 5,313
Craftsmen, Foremen, and Kindred Workers 12,101 172 2,836 3,251 17,269 1,382 4,609 7,896
Automobile Mechanics and Body Workers 1,072 11 365 372 1,980 149 462 881
Mechanics and Repair Men, Except Auto 2,633 22 385 477 2,589 131 748 1,145
Machinists 242 0 26 46 248 39 28 130
Metal Craftsmen, Except Mechanics and Machinists 169 5 29 67 451 46 107 199
Carpenters 962 14 312 438 1,628 196 505 686
Construction Craftsmen 2,526 33 651 792 4,161 383 1,139 2,063
Others Craftsmen 4,497 87 1,068 1,059 6,212 438 1,620 2,792
Operatives, Except Transport, Workers 4,832 128 2,150 2,180 9,301 837 2,674 3,442
Manufacturing Durable Goods Workers 2,137 36 556 492 2,608 386 946 1,235
Manufacturing Non-Durable Goods Workers 343 8 388 623 1,751 96 589 349
Non-Manufacturing Industry 2,352 84 1,206 1,065 4,942 355 1,139 1,858
Transport Equipment Operators 1,803 47 1,179 1,115 5,309 388 1,213 1,719
Truck Drivers 658 26 703 528 2,463 223 631 659
Other Transport Equipment Operatives 1,145 21 476 587 2,846 165 582 1,060
Laborers, Except Farms 2,947 126 1,138 1,445 6,263 417 1,440 2,925
Construction Laborers 767 37 269 299 1,578 116 457 639
Freight, Stock, and Material Handlers 949 23 298 473 2,076 123 395 612
Other Laborers, Except Farm 1,231 66 571 673 2,609 178 588 1,674
Farmers and Farm Managers 169 44 560 587 566 156 220 335
Farm Laborers and Farm Foremen 595 101 2,595 1,466 3,797 574 1,357 973
Farm Laborers, Unpaid Family Workers 12 0 26 13 49 6 9 14
Farm Laborers, Except Unpaid and Farm Foremen 583 101 2,569 1,453 3,748 568 1,348 959
Service Workers, Except Private Household 9,233 208 2,351 3,143 13,759 1,202 2,836 9,290
Cleaning Service Workers 2,168 100 467 674 2,473 199 588 2,063
Food Service Workers 2,974 56 810 1,103 4,824 414 973 3,362
Health Service Workers 765 10 333 307 1,889 236 420 1,174
Personal Service Workers 1,282 10 322 437 1,958 101 400 1,112
Protective Service Workers 1,366 24 224 402 1,493 144 301 885
Service Workers, Except Private Household 678 8 195 220 1,122 108 154 694
Private Household Workers 1,099 45 755 818 2,943 171 623 1,483
Document Item Type Metadata
Original Format
1 table
Collection
Citation
U.S. Census Bureau, “U.S. Census for Central Florida, 1970,” RICHES, accessed July 14, 2026, https://richesmi.cah.ucf.edu/omeka/items/show/3843.