U.S. Census for Central Florida, 1980
Dublin Core
Title
U.S. Census for Central Florida, 1980
Alternative Title
Census, 1980
Subject
Census--United States
Orange County (Fla.)
Marion County (Fla.)
Brevard County (Fla.)
St. Lucie County (Fla.)
Seminole County (Fla.)
Volusia County (Fla.)
Flagler County (Fla.)
Lake County (Fla.)
Osceola County (Fla.)
Population--United States
Description
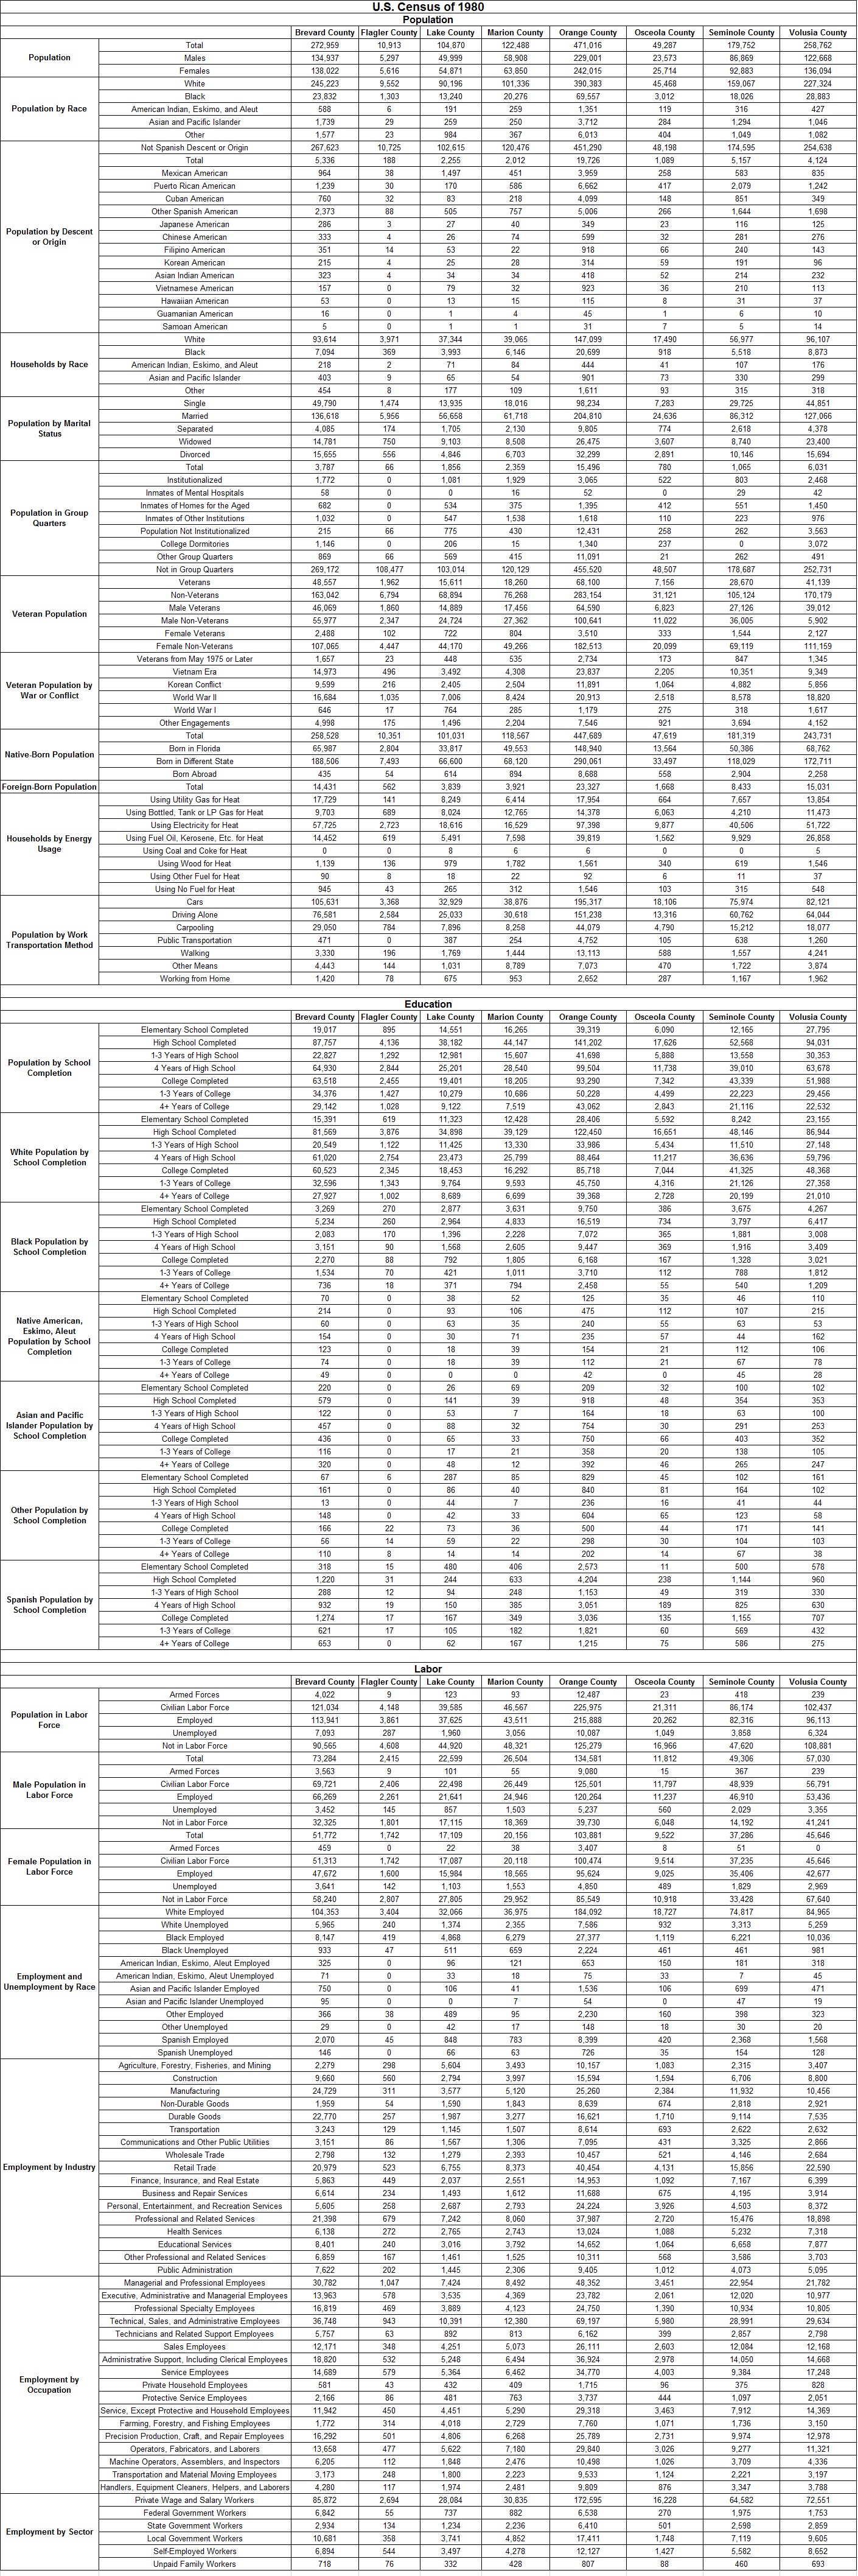
The Twentieth United States Census records for Brevard County, Flagler County, Lake County, Marion County, Orange County, Osceola County, Seminole County, and Volusia County, Florida for 1980. The census divides the population by gender, race ("white," "black," "American Indian, Eskimo, and Aleut," "Asian and Pacific Islander," "Spanish," "Mexican American," "Puerto Rican American," "Cuban American," "Other Spanish American," "Chinese American," "Japanese American," "Filipino American," "Korean American," "Asian Indian American," "Vietnamese American," "Hawaiian American," "Guamanian American," and "Samoan American"), and native-born vs. foreign-born. Those who are foreign born are further divided by country of origin. The census then lists the population categorized by marital status, type of residence, military service, primary and secondary school attendance, and college attendance. The census also collected information on labor, on unemployment, and on transportation.
Due to the success of the 1970 Census' mail-out/mail-back questionnaire, the program was expanded for the Census of 1980 to include approximately 95 percent of the population. The short-form questionnaire for this census contained seven questions related to population and 11 questions related to housing; whereas the long-form questionnaire included 26 questions on population and 10 questions on housing. A question regarding Spanish or Hispanic origin, separate from race inquires, was used in all questionnaires due to its success in a five-percent sample for the 1970 Census. Two surveys were included in the new census: the Components of Inventory Change Survey, making inquiries regarding the number and characteristics of housing units that either changed or remained the same between 1973 and 1980; and the Residential Finance Survey, which collected information on mortgages, shelter costs, housing characteristics, and owner characteristics. The U.S. Census Bureau's Census Publicity Office, established in 1978, directed an extensive public service advertising campaign focusing on public awareness of the census and encouraging individuals to participate. A special effort was made to enumerate groups that have historically been undercounted in previous censuses: "M-Night" focused on counting individuals in homeless shelters, soup kitchens, bus and railway stations, and dormitories; "T-Night" focused on the enumeration of hotels and motels with permanent residents.
The State Data Center Program was established to simplify public access to census data via computer tapes. The Census Bureau was to provide free copies of electronic and printed census information and products to each state; in return, the state agreed to develop a network of affiliated organizations, such as state executive departments, chambers of commerce, councils of government, university research departments, and libraries, by which census information would be housed for public access. All states had joined the program by the middle of the decade.
Despite various technological and procedural advances, the U.S. Census undercounted the national population, as it typically did in previous censuses. The African-American population had an estimated net undercount rate that was 3.7 percentage points higher than the rate for all other races combined. Various cities and states, beginning with the City of Detroit, filed suit against the U.S. Census Bureau, demanding that statistical adjustment be used to compensate for census estimates that had been omitted or improperly counted. In the Fall of 1980, the Bureau announced that it would not adjust its population totals because it was unable to determine the number and distribution of illegal aliens and other undercounted groups. A federal district court ruled in favor of the City of New York and the State of New York that same year, ordering the Census Bureau to correct its numbers. The U.S. Supreme Court stayed this ruling, as well as other similar rulings, in December of 1980, which allowed the Bureau to report its figures to the President unadjusted. In 1987, a federal appeals court ruled that the census figures should not be adjusted because the Census Bureau's decision not to adjust the figures was not arbitrary nor capricious.
Creator
Source
Original census data collected by the U.S. Census Bureau, 1980.
Publisher
Date Created
ca. 1980-04-01
Contributor
Gibson, Ella
Is Format Of
Digital reproduction of original census data collected by the U.S. Census Bureau, 1980.
Is Part Of
U.S. Census Collection, RICHES of Central Florida.
Format
image/jpg
Extent
2.26 MB
Medium
1 table
Language
eng
Type
Dataset
Coverage
Brevard County, Florida
Flagler County, Florida
Lake County, Florida
Marion County, Florida
Orange County, Florida
Osceola County, Florida
Seminole County, Florida
Volusia County, Florida
Accrual Method
Item Creation
Mediator
History Teacher
Economics Teacher
Civics/Government Teacher
Geography Teacher
Provenance
Originally collected by the U.S. Census Bureau and published by the U.S. Department of Commerce.
Rights Holder
This resource is not subject to copyright in the United States and there are no copyright restrictions on reproduction, derivative works, distribution, performance, or display of the work. Anyone may, without restriction under U.S. copyright laws:
- reproduce the work in print or digital form;
- create derivative works;
- perform the work publicly;
- display the work;
- distribute copies or digitally transfer the work to the public by sale or other transfer of ownership, or by rental, lease, or lending.
Curator
Cepero, Laura
Digital Collection
Source Repository
External Reference
"1980 Overview." U.S. Census Bureau. https://www.census.gov/history/www/through_the_decades/overview/1980.html.
United States, and Carroll D. Wright. The History and Growth of the United States Census. Washington: U.S. Government Printing Office, 1970. https://www.census.gov/history/pdf/wright-hunt.pdf.
U.S. Bureau of the Census. Procedural History: 1980 Census of Population and Housing. Washington: U.S. Government Printing Office, 1966.
Transcript
U.S. Census of 1980
Population
Brevard County Flagler County Lake County Marion County Orange County Osceola County Seminole County Volusia County
Population Total 272,959 10,913 104,870 122,488 471,016 49,287 179,752 258,762
Males 134,937 5,297 49,999 58,908 229,001 23,573 86,869 122,668
Females 138,022 5,616 54,871 63,850 242,015 25,714 92,883 136,094
Population by Race White 245,223 9,552 90,196 101,336 390,383 45,468 159,067 227,324
Black 23,832 1,303 13,240 20,276 69,557 3,012 18,026 28,883
American Indian, Eskimo, and Aleut 588 6 191 259 1,351 119 316 427
Asian and Pacific Islander 1,739 29 259 250 3,712 284 1,294 1,046
Other 1,577 23 984 367 6,013 404 1,049 1,082
Population by Descent or Origin Not Spanish Descent or Origin 267,623 10,725 102,615 120,476 451,290 48,198 174,595 254,638
Total 5,336 188 2,255 2,012 19,726 1,089 5,157 4,124
Mexican American 964 38 1,497 451 3,959 258 583 835
Puerto Rican American 1,239 30 170 586 6,662 417 2,079 1,242
Cuban American 760 32 83 218 4,099 148 851 349
Other Spanish American 2,373 88 505 757 5,006 266 1,644 1,698
Japanese American 286 3 27 40 349 23 116 125
Chinese American 333 4 26 74 599 32 281 276
Filipino American 351 14 53 22 918 66 240 143
Korean American 215 4 25 28 314 59 191 96
Asian Indian American 323 4 34 34 418 52 214 232
Vietnamese American 157 0 79 32 923 36 210 113
Hawaiian American 53 0 13 15 115 8 31 37
Guamanian American 16 0 1 4 45 1 6 10
Samoan American 5 0 1 1 31 7 5 14
Households by Race White 93,614 3,971 37,344 39,065 147,099 17,490 56,977 96,107
Black 7,094 369 3,993 6,146 20,699 918 5,518 8,873
American Indian, Eskimo, and Aleut 218 2 71 84 444 41 107 176
Asian and Pacific Islander 403 9 65 54 901 73 330 299
Other 454 8 177 109 1,611 93 315 318
Population by Marital Status Single 49,790 1,474 13,935 18,016 98,234 7,283 29,725 44,851
Married 136,618 5,956 56,658 61,718 204,810 24,636 86,312 127,066
Separated 4,085 174 1,705 2,130 9,805 774 2,618 4,378
Widowed 14,781 750 9,103 8,508 26,475 3,607 8,740 23,400
Divorced 15,655 556 4,846 6,703 32,299 2,891 10,146 15,694
Population in Group Quarters Total 3,787 66 1,856 2,359 15,496 780 1,065 6,031
Institutionalized 1,772 0 1,081 1,929 3,065 522 803 2,468
Inmates of Mental Hospitals 58 0 0 16 52 0 29 42
Inmates of Homes for the Aged 682 0 534 375 1,395 412 551 1,450
Inmates of Other Institutions 1,032 0 547 1,538 1,618 110 223 976
Population Not Institutionalized 215 66 775 430 12,431 258 262 3,563
College Dormitories 1,146 0 206 15 1,340 237 0 3,072
Other Group Quarters 869 66 569 415 11,091 21 262 491
Not in Group Quarters 269,172 108,477 103,014 120,129 455,520 48,507 178,687 252,731
Veteran Population Veterans 48,557 1,962 15,611 18,260 68,100 7,156 28,670 41,139
Non-Veterans 163,042 6,794 68,894 76,268 283,154 31,121 105,124 170,179
Male Veterans 46,069 1,860 14,889 17,456 64,590 6,823 27,126 39,012
Male Non-Veterans 55,977 2,347 24,724 27,362 100,641 11,022 36,005 5,902
Female Veterans 2,488 102 722 804 3,510 333 1,544 2,127
Female Non-Veterans 107,065 4,447 44,170 49,266 182,513 20,099 69,119 111,159
Veteran Population by War or Conflict Veterans from May 1975 or Later 1,657 23 448 535 2,734 173 847 1,345
Vietnam Era 14,973 496 3,492 4,308 23,837 2,205 10,351 9,349
Korean Conflict 9,599 216 2,405 2,504 11,891 1,064 4,882 5,856
World War II 16,684 1,035 7,006 8,424 20,913 2,518 8,578 18,820
World War I 646 17 764 285 1,179 275 318 1,617
Other Engagements 4,998 175 1,496 2,204 7,546 921 3,694 4,152
Native-Born Population Total 258,528 10,351 101,031 118,567 447,689 47,619 181,319 243,731
Born in Florida 65,987 2,804 33,817 49,553 148,940 13,564 50,386 68,762
Born in Different State 188,506 7,493 66,600 68,120 290,061 33,497 118,029 172,711
Born Abroad 435 54 614 894 8,688 558 2,904 2,258
Foreign-Born Population Total 14,431 562 3,839 3,921 23,327 1,668 8,433 15,031
Households by Energy Usage Using Utility Gas for Heat 17,729 141 8,249 6,414 17,954 664 7,657 13,854
Using Bottled, Tank or LP Gas for Heat 9,703 689 8,024 12,765 14,378 6,063 4,210 11,473
Using Electricity for Heat 57,725 2,723 18,616 16,529 97,398 9,877 40,506 51,722
Using Fuel Oil, Kerosene, Etc. for Heat 14,452 619 5,491 7,598 39,819 1,562 9,929 26,858
Using Coal and Coke for Heat 0 0 8 6 6 0 0 5
Using Wood for Heat 1,139 136 979 1,782 1,561 340 619 1,546
Using Other Fuel for Heat 90 8 18 22 92 6 11 37
Using No Fuel for Heat 945 43 265 312 1,546 103 315 548
Population by Work Transportation Method Cars 105,631 3,368 32,929 38,876 195,317 18,106 75,974 82,121
Driving Alone 76,581 2,584 25,033 30,618 151,238 13,316 60,762 64,044
Carpooling 29,050 784 7,896 8,258 44,079 4,790 15,212 18,077
Public Transportation 471 0 387 254 4,752 105 638 1,260
Walking 3,330 196 1,769 1,444 13,113 588 1,557 4,241
Other Means 4,443 144 1,031 8,789 7,073 470 1,722 3,874
Working from Home 1,420 78 675 953 2,652 287 1,167 1,962
Education
Brevard County Flagler County Lake County Marion County Orange County Osceola County Seminole County Volusia County
Population by School Completion Elementary School Completed 19,017 895 14,551 16,265 39,319 6,090 12,165 27,795
High School Completed 87,757 4,136 38,182 44,147 141,202 17,626 52,568 94,031
1-3 Years of High School 22,827 1,292 12,981 15,607 41,698 5,888 13,558 30,353
4 Years of High School 64,930 2,844 25,201 28,540 99,504 11,738 39,010 63,678
College Completed 63,518 2,455 19,401 18,205 93,290 7,342 43,339 51,988
1-3 Years of College 34,376 1,427 10,279 10,686 50,228 4,499 22,223 29,456
4+ Years of College 29,142 1,028 9,122 7,519 43,062 2,843 21,116 22,532
White Population by School Completion Elementary School Completed 15,391 619 11,323 12,428 28,406 5,592 8,242 23,155
High School Completed 81,569 3,876 34,898 39,129 122,450 16,651 48,146 86,944
1-3 Years of High School 20,549 1,122 11,425 13,330 33,986 5,434 11,510 27,148
4 Years of High School 61,020 2,754 23,473 25,799 88,464 11,217 36,636 59,796
College Completed 60,523 2,345 18,453 16,292 85,718 7,044 41,325 48,368
1-3 Years of College 32,596 1,343 9,764 9,593 45,750 4,316 21,126 27,358
4+ Years of College 27,927 1,002 8,689 6,699 39,368 2,728 20,199 21,010
Black Population by School Completion Elementary School Completed 3,269 270 2,877 3,631 9,750 386 3,675 4,267
High School Completed 5,234 260 2,964 4,833 16,519 734 3,797 6,417
1-3 Years of High School 2,083 170 1,396 2,228 7,072 365 1,881 3,008
4 Years of High School 3,151 90 1,568 2,605 9,447 369 1,916 3,409
College Completed 2,270 88 792 1,805 6,168 167 1,328 3,021
1-3 Years of College 1,534 70 421 1,011 3,710 112 788 1,812
4+ Years of College 736 18 371 794 2,458 55 540 1,209
Native American, Eskimo, Aleut Population by School Completion Elementary School Completed 70 0 38 52 125 35 46 110
High School Completed 214 0 93 106 475 112 107 215
1-3 Years of High School 60 0 63 35 240 55 63 53
4 Years of High School 154 0 30 71 235 57 44 162
College Completed 123 0 18 39 154 21 112 106
1-3 Years of College 74 0 18 39 112 21 67 78
4+ Years of College 49 0 0 0 42 0 45 28
Asian and Pacific Islander Population by School Completion Elementary School Completed 220 0 26 69 209 32 100 102
High School Completed 579 0 141 39 918 48 354 353
1-3 Years of High School 122 0 53 7 164 18 63 100
4 Years of High School 457 0 88 32 754 30 291 253
College Completed 436 0 65 33 750 66 403 352
1-3 Years of College 116 0 17 21 358 20 138 105
4+ Years of College 320 0 48 12 392 46 265 247
Other Population by School Completion Elementary School Completed 67 6 287 85 829 45 102 161
High School Completed 161 0 86 40 840 81 164 102
1-3 Years of High School 13 0 44 7 236 16 41 44
4 Years of High School 148 0 42 33 604 65 123 58
College Completed 166 22 73 36 500 44 171 141
1-3 Years of College 56 14 59 22 298 30 104 103
4+ Years of College 110 8 14 14 202 14 67 38
Spanish Population by School Completion Elementary School Completed 318 15 480 406 2,573 11 500 578
High School Completed 1,220 31 244 633 4,204 238 1,144 960
1-3 Years of High School 288 12 94 248 1,153 49 319 330
4 Years of High School 932 19 150 385 3,051 189 825 630
College Completed 1,274 17 167 349 3,036 135 1,155 707
1-3 Years of College 621 17 105 182 1,821 60 569 432
4+ Years of College 653 0 62 167 1,215 75 586 275
Labor
Brevard County Flagler County Lake County Marion County Orange County Osceola County Seminole County Volusia County
Population in Labor Force Armed Forces 4,022 9 123 93 12,487 23 418 239
Civilian Labor Force 121,034 4,148 39,585 46,567 225,975 21,311 86,174 102,437
Employed 113,941 3,861 37,625 43,511 215,888 20,262 82,316 96,113
Unemployed 7,093 287 1,960 3,056 10,087 1,049 3,858 6,324
Not in Labor Force 90,565 4,608 44,920 48,321 125,279 16,966 47,620 108,881
Male Population in Labor Force Total 73,284 2,415 22,599 26,504 134,581 11,812 49,306 57,030
Armed Forces 3,563 9 101 55 9,080 15 367 239
Civilian Labor Force 69,721 2,406 22,498 26,449 125,501 11,797 48,939 56,791
Employed 66,269 2,261 21,641 24,946 120,264 11,237 46,910 53,436
Unemployed 3,452 145 857 1,503 5,237 560 2,029 3,355
Not in Labor Force 32,325 1,801 17,115 18,369 39,730 6,048 14,192 41,241
Female Population in Labor Force Total 51,772 1,742 17,109 20,156 103,881 9,522 37,286 45,646
Armed Forces 459 0 22 38 3,407 8 51 0
Civilian Labor Force 51,313 1,742 17,087 20,118 100,474 9,514 37,235 45,646
Employed 47,672 1,600 15,984 18,565 95,624 9,025 35,406 42,677
Unemployed 3,641 142 1,103 1,553 4,850 489 1,829 2,969
Not in Labor Force 58,240 2,807 27,805 29,952 85,549 10,918 33,428 67,640
Employment and Unemployment by Race White Employed 104,353 3,404 32,066 36,975 184,092 18,727 74,817 84,965
White Unemployed 5,965 240 1,374 2,355 7,586 932 3,313 5,259
Black Employed 8,147 419 4,868 6,279 27,377 1,119 6,221 10,036
Black Unemployed 933 47 511 659 2,224 461 461 981
American Indian, Eskimo, Aleut Employed 325 0 96 121 653 150 181 318
American Indian, Eskimo, Aleut Unemployed 71 0 33 18 75 33 7 45
Asian and Pacific Islander Employed 750 0 106 41 1,536 106 699 471
Asian and Pacific Islander Unemployed 95 0 0 7 54 0 47 19
Other Employed 366 38 489 95 2,230 160 398 323
Other Unemployed 29 0 42 17 148 18 30 20
Spanish Employed 2,070 45 848 783 8,399 420 2,368 1,568
Spanish Unemployed 146 0 66 63 726 35 154 128
Employment by Industry Agriculture, Forestry, Fisheries, and Mining 2,279 298 5,604 3,493 10,157 1,083 2,315 3,407
Construction 9,660 560 2,794 3,997 15,594 1,594 6,706 8,800
Manufacturing 24,729 311 3,577 5,120 25,260 2,384 11,932 10,456
Non-Durable Goods 1,959 54 1,590 1,843 8,639 674 2,818 2,921
Durable Goods 22,770 257 1,987 3,277 16,621 1,710 9,114 7,535
Transportation 3,243 129 1,145 1,507 8,614 693 2,622 2,632
Communications and Other Public Utilities 3,151 86 1,567 1,306 7,095 431 3,325 2,866
Wholesale Trade 2,798 132 1,279 2,393 10,457 521 4,146 2,684
Retail Trade 20,979 523 6,755 8,373 40,454 4,131 15,856 22,590
Finance, Insurance, and Real Estate 5,863 449 2,037 2,551 14,953 1,092 7,167 6,399
Business and Repair Services 6,614 234 1,493 1,612 11,688 675 4,195 3,914
Personal, Entertainment, and Recreation Services 5,605 258 2,687 2,793 24,224 3,926 4,503 8,372
Professional and Related Services 21,398 679 7,242 8,060 37,987 2,720 15,476 18,898
Health Services 6,138 272 2,765 2,743 13,024 1,088 5,232 7,318
Educational Services 8,401 240 3,016 3,792 14,652 1,064 6,658 7,877
Other Professional and Related Services 6,859 167 1,461 1,525 10,311 568 3,586 3,703
Public Administration 7,622 202 1,445 2,306 9,405 1,012 4,073 5,095
Employment by Occupation Managerial and Professional Employees 30,782 1,047 7,424 8,492 48,352 3,451 22,954 21,782
Executive, Administrative and Managerial Employees 13,963 578 3,535 4,369 23,782 2,061 12,020 10,977
Professional Specialty Employees 16,819 469 3,889 4,123 24,750 1,390 10,934 10,805
Technical, Sales, and Administrative Employees 36,748 943 10,391 12,380 69,197 5,980 28,991 29,634
Technicians and Related Support Employees 5,757 63 892 813 6,162 399 2,857 2,798
Sales Employees 12,171 348 4,251 5,073 26,111 2,603 12,084 12,168
Administrative Support, Including Clerical Employees 18,820 532 5,248 6,494 36,924 2,978 14,050 14,668
Service Employees 14,689 579 5,364 6,462 34,770 4,003 9,384 17,248
Private Household Employees 581 43 432 409 1,715 96 375 828
Protective Service Employees 2,166 86 481 763 3,737 444 1,097 2,051
Service, Except Protective and Household Employees 11,942 450 4,451 5,290 29,318 3,463 7,912 14,369
Farming, Forestry, and Fishing Employees 1,772 314 4,018 2,729 7,760 1,071 1,736 3,150
Precision Production, Craft, and Repair Employees 16,292 501 4,806 6,268 25,789 2,731 9,974 12,978
Operators, Fabricators, and Laborers 13,658 477 5,622 7,180 29,840 3,026 9,277 11,321
Machine Operators, Assemblers, and Inspectors 6,205 112 1,848 2,476 10,498 1,026 3,709 4,336
Transportation and Material Moving Employees 3,173 248 1,800 2,223 9,533 1,124 2,221 3,197
Handlers, Equipment Cleaners, Helpers, and Laborers 4,280 117 1,974 2,481 9,809 876 3,347 3,788
Employment by Sector Private Wage and Salary Workers 85,872 2,694 28,084 30,835 172,595 16,228 64,582 72,551
Federal Government Workers 6,842 55 737 882 6,538 270 1,975 1,753
State Government Workers 2,934 134 1,234 2,236 6,410 501 2,598 2,859
Local Government Workers 10,681 358 3,741 4,852 17,411 1,748 7,119 9,605
Self-Employed Workers 6,894 544 3,497 4,278 12,127 1,427 5,582 8,652
Unpaid Family Workers 718 76 332 428 807 88 460 693
Document Item Type Metadata
Original Format
1 table
Collection
Citation
U.S. Census Bureau, “U.S. Census for Central Florida, 1980,” RICHES, accessed July 28, 2026, https://richesmi.cah.ucf.edu/omeka/items/show/3844.