U.S. Census for Central Florida, 1990
Dublin Core
Title
U.S. Census for Central Florida, 1990
Alternative Title
Census, 1990
Subject
Census--United States
Orange County (Fla.)
Marion County (Fla.)
Brevard County (Fla.)
St. Lucie County (Fla.)
Seminole County (Fla.)
Volusia County (Fla.)
Flagler County (Fla.)
Lake County (Fla.)
Osceola County (Fla.)
Population--United States
Description
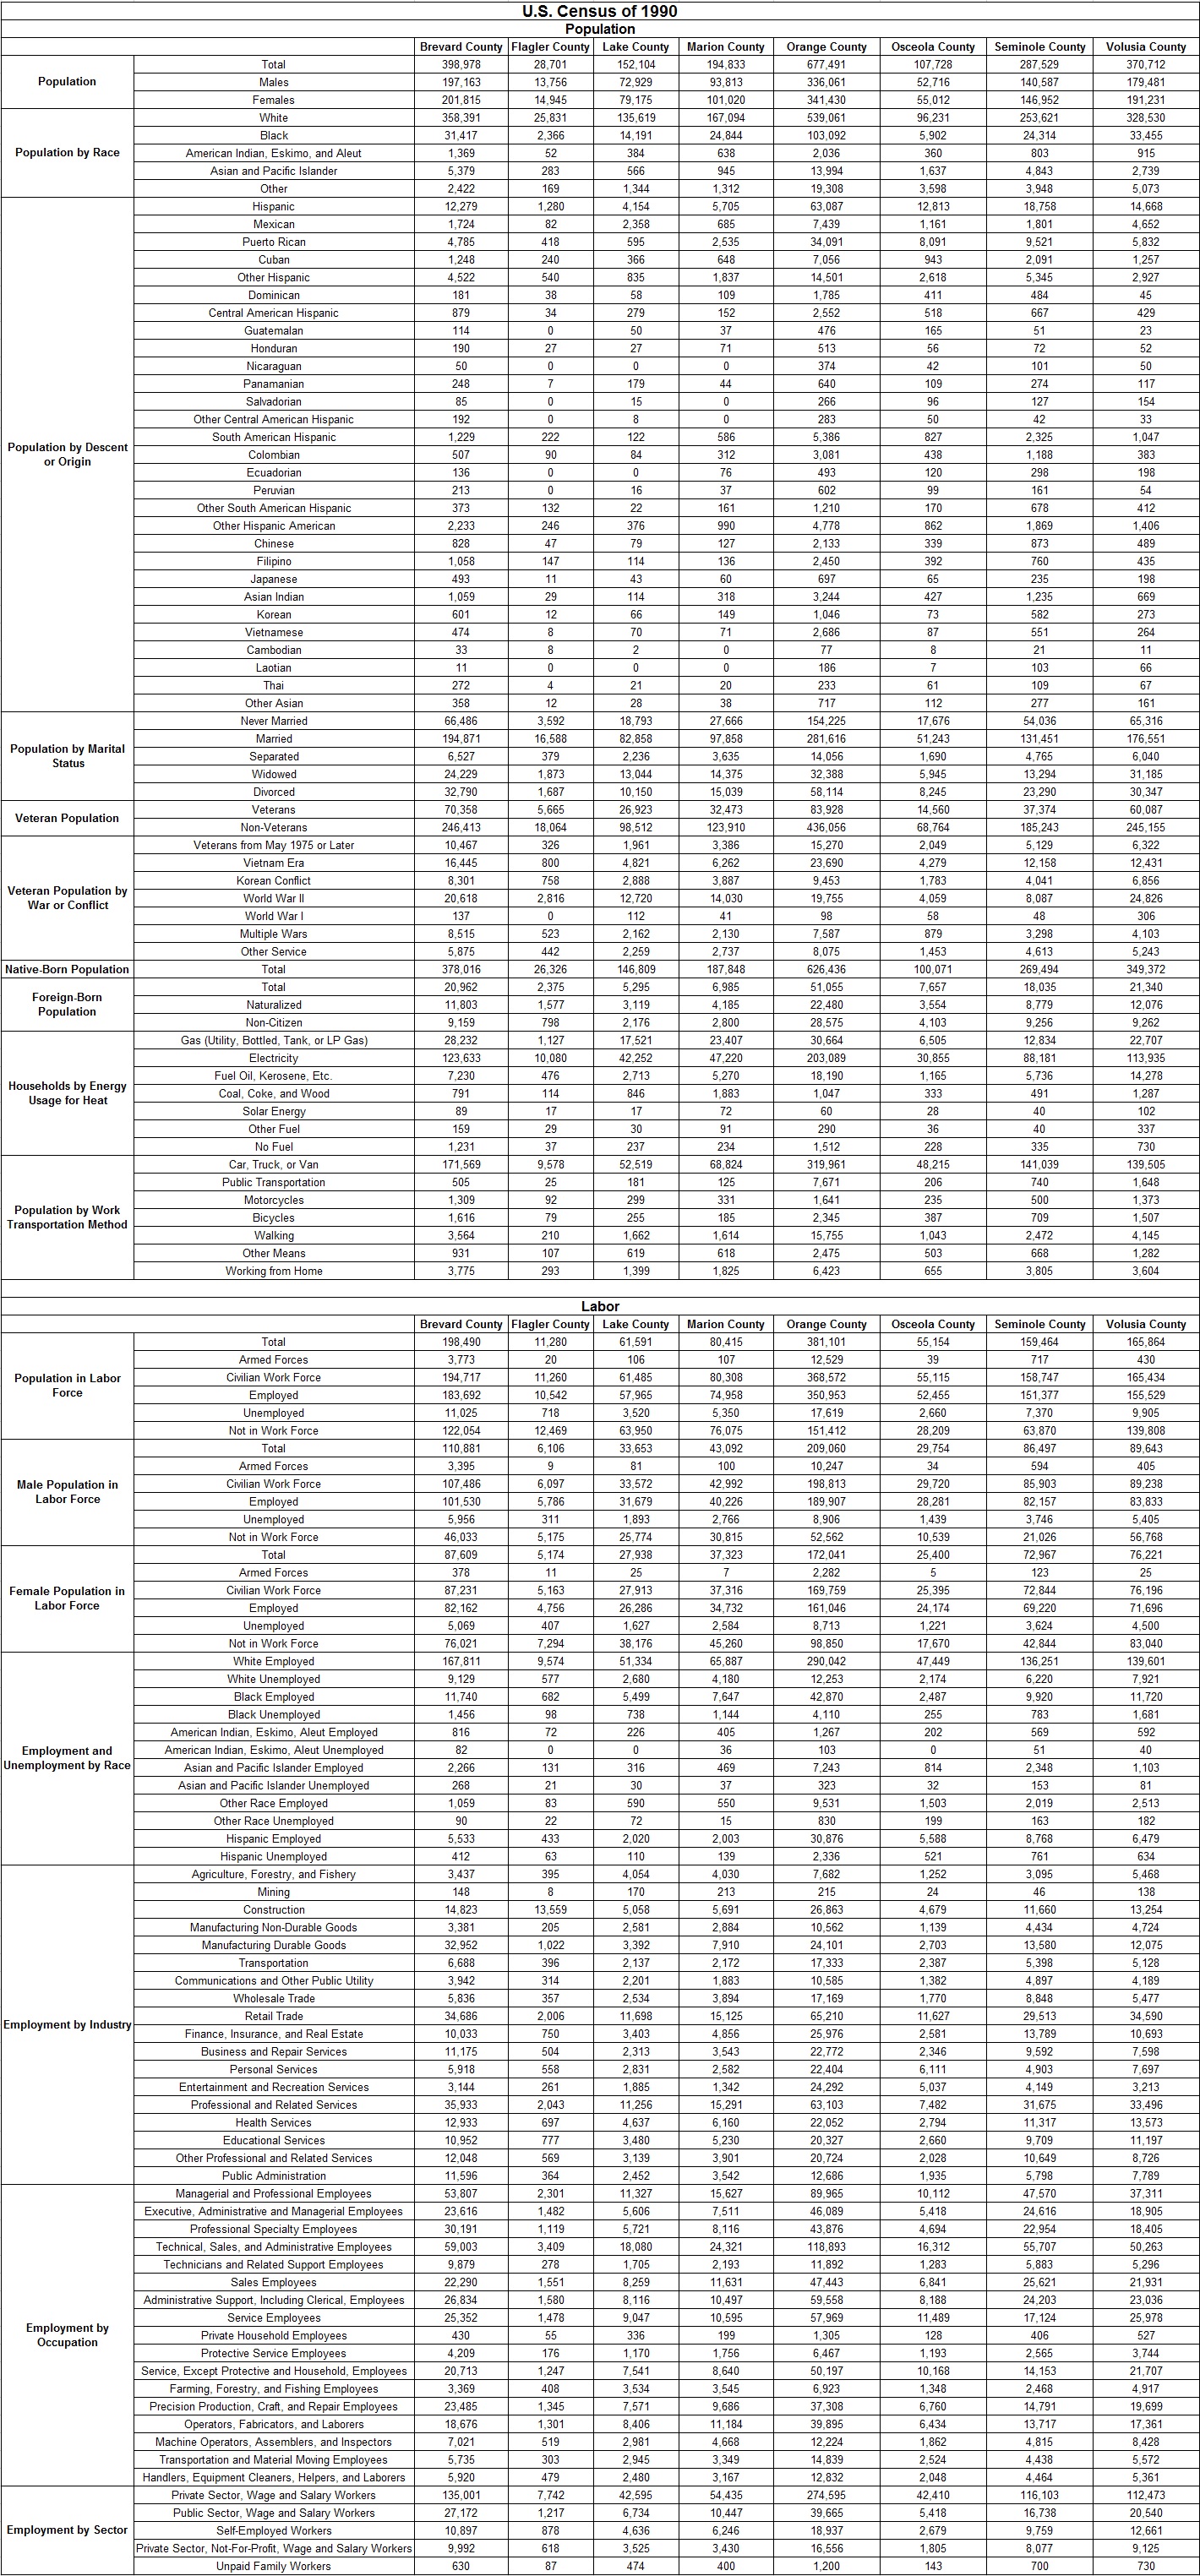
The Twenty-First United States Census records for Brevard County, Flagler County, Lake County, Marion County, Orange County, Osceola County, Seminole County, and Volusia County, Florida, for 1990. The census divides the population by gender, race ("white," "black," "American Indian, Eskimo, or Aleut," "Asian or Pacific Islander," "other," "Hispanic," "Mexican," "Puerto Rican," "Cuban," "Other Hispanic," "Dominican," "Central American Hispanic," "Guatemalan," "Honduran," "Nicaraguan," "Panamanian," "Salvadorian," "Other Central American Hispanic," "South American Hispanic," "Columbian," "Ecuadorian," "Peruvian," "Other South American Hispanic," "Chinese," "Japanese," "Filipino," "Korean," "Asian Indian," "Vietnamese," "Cambodian," "Laotian," "Thai," and "Other Asian"), and native-born vs. foreign-born. Those who are foreign born are further divided by country of origin. The census then lists the population categorized by marital status and military service. The census also collected information on labor, on unemployment, on energy usage, and on transportation.
For the 1990 Census, the U.S. Census Bureau utilized extensive user consultation prior to enumeration in order to refine both long and short form census questionnaires. The short form consisted of 13 questions and was given to the entire population. The long form asked 45 questions and was given to a 20-percent sample. The long form included topics related to marital history, carpooling, residence, residential elevators, and energy usage. Unlike the 1980 Census, the new census eliminated questions regarding air conditioning, the number of bathrooms in a residence, and the type of heating equipment used. A vast advertising campaign was marketed to increase public awareness of the census via public television, radio, and print media. Like the previous census, the Census of 1990 made a special effort to enumerate groups that have historically been undercounted in previous censuses called "S-Night": individuals in homeless shelters, soup kitchens, bus and railway stations, and dormitories (enumerated separately in the 1980 Census on "M-Night"); and permanent residents in hotels and motels (enumerated separately in the 1980 Census on "T-Night"). Following legal issues filed in response to the 1980 Census regarding statistical readjustment of undercounted areas, the Census Bureau initiated a post-enumeration survey (PES), in which a contemporaneous survey of households would be conducted and compared to the census results from the official census. In a partial resolution of a 1989 lawsuit filed by New York plaintiffs, the U.S. Department of Commerce agreed to use the PES to produce population data that had been adjusted for the projected undercount and that said data would be judged against the unadjusted data by the Secretary of Commerce's Special Advisory Panel (SAP).
The Census of 1990 also introduced the U.S. to the Topologically Integrated Geographic Encoding and Referencing System (TIGER), which was developed by the U.S. Geological Survey and the Census Bureau. TIGER used computerized representations of various map features to geographically code addresses into appropriate census geographic areas. It also produced different maps required for census data collection and tabulation. Five years earlier, the Census Bureau became the first government agency to publish information on CD-ROM. For the 1990 Census, the bureau made detailed census data, which had previously been only available to organizations with large mainframe computers, accessible to any individual with a personal computer. Census data was also available in print, on computer tape, and on microfiche. Using two online service vendors, DIALOG and CompuServe, the Census Bureau also published select census data online.
As with previous censuses, the 1990 Census undercounted the national population, and again, the African-American population had an estimated net undercount rate that was significantly higher than the rate for other races. In July of 1991, the Secretary of Commerce announced that he did not find evidence in favor of using adjusted counts compelling—despite SAP's split vote on the issue—and chose to use unadjusted totals for the official census results. In response, the New York plaintiffs resumed the lawsuit against the U.S. Department of Commerce. A federal district court ruleded in favor of the DOC in April of 1993. The U.S. Court of Appeals, however, rejected the previous court ruling and ordered that the case be reheard by the federal district court. In March of 1996, the U.S. Supreme Court finally ruled in favor of the Secretary of Commerce's decision to use the unadjusted census date, but did not rule on the legality or constitutionality of the use of statistical adjustment in producing apportionment counts.
Creator
Source
Original census data collected by the U.S. Census Bureau, 1990.
Publisher
Date Created
ca. 1990-04-01
Contributor
Gibson, Ella
Is Format Of
Digital reproduction of original census data collected by the U.S. Census Bureau, 1990.
Is Part Of
U.S. Census Collection, RICHES of Central Florida.
Format
image/jpg
Extent
1.65 MB
Medium
1 table
Language
eng
Type
Dataset
Coverage
Brevard County, Florida
Flagler County, Florida
Lake County, Florida
Marion County, Florida
Orange County, Florida
Osceola County, Florida
Seminole County, Florida
Volusia County, Florida
Accrual Method
Item Creation
Mediator
History Teacher
Economics Teacher
Civics/Government Teacher
Geography Teacher
Provenance
Originally collected by the U.S. Census Bureau and published by the U.S. Department of Commerce.
Rights Holder
This resource is not subject to copyright in the United States and there are no copyright restrictions on reproduction, derivative works, distribution, performance, or display of the work. Anyone may, without restriction under U.S. copyright laws:
- reproduce the work in print or digital form
- create derivative works
- perform the work publicly
- display the work
- distribute copies or digitally transfer the work to the public by sale or other transfer of ownership, or by rental, lease, or lending.
Curator
Cepero, Laura
Digital Collection
Source Repository
External Reference
"1990 Overview." U.S. Census Bureau. https://www.census.gov/history/www/through_the_decades/overview/1990.html.
United States, and Carroll D. Wright. The History and Growth of the United States Census. Washington: U.S. Government Printing Office, 1970. https://www.census.gov/history/pdf/wright-hunt.pdf.
U.S. Bureau of the Census. Procedural History: 1990 Census of Population and Housing. Washington: U.S. Government Printing Office, 1966.
Transcript
U.S. Census of 1990
Population
Brevard County Flagler County Lake County Marion County Orange County Osceola County Seminole County Volusia County
Population Total 398,978 28,701 152,104 194,833 677,491 107,728 287,529 370,712
Males 197,163 13,756 72,929 93,813 336,061 52,716 140,587 179,481
Females 201,815 14,945 79,175 101,020 341,430 55,012 146,952 191,231
Population by Race White 358,391 25,831 135,619 167,094 539,061 96,231 253,621 328,530
Black 31,417 2,366 14,191 24,844 103,092 5,902 24,314 33,455
American Indian, Eskimo, and Aleut 1,369 52 384 638 2,036 360 803 915
Asian and Pacific Islander 5,379 283 566 945 13,994 1,637 4,843 2,739
Other 2,422 169 1,344 1,312 19,308 3,598 3,948 5,073
Population by Descent or Origin Hispanic 12,279 1,280 4,154 5,705 63,087 12,813 18,758 14,668
Mexican 1,724 82 2,358 685 7,439 1,161 1,801 4,652
Puerto Rican 4,785 418 595 2,535 34,091 8,091 9,521 5,832
Cuban 1,248 240 366 648 7,056 943 2,091 1,257
Other Hispanic 4,522 540 835 1,837 14,501 2,618 5,345 2,927
Dominican 181 38 58 109 1,785 411 484 45
Central American Hispanic 879 34 279 152 2,552 518 667 429
Guatemalan 114 0 50 37 476 165 51 23
Honduran 190 27 27 71 513 56 72 52
Nicaraguan 50 0 0 0 374 42 101 50
Panamanian 248 7 179 44 640 109 274 117
Salvadorian 85 0 15 0 266 96 127 154
Other Central American Hispanic 192 0 8 0 283 50 42 33
South American Hispanic 1,229 222 122 586 5,386 827 2,325 1,047
Colombian 507 90 84 312 3,081 438 1,188 383
Ecuadorian 136 0 0 76 493 120 298 198
Peruvian 213 0 16 37 602 99 161 54
Other South American Hispanic 373 132 22 161 1,210 170 678 412
Other Hispanic American 2,233 246 376 990 4,778 862 1,869 1,406
Chinese 828 47 79 127 2,133 339 873 489
Filipino 1,058 147 114 136 2,450 392 760 435
Japanese 493 11 43 60 697 65 235 198
Asian Indian 1,059 29 114 318 3,244 427 1,235 669
Korean 601 12 66 149 1,046 73 582 273
Vietnamese 474 8 70 71 2,686 87 551 264
Cambodian 33 8 2 0 77 8 21 11
Laotian 11 0 0 0 186 7 103 66
Thai 272 4 21 20 233 61 109 67
Other Asian 358 12 28 38 717 112 277 161
Population by Marital Status Never Married 66,486 3,592 18,793 27,666 154,225 17,676 54,036 65,316
Married 194,871 16,588 82,858 97,858 281,616 51,243 131,451 176,551
Separated 6,527 379 2,236 3,635 14,056 1,690 4,765 6,040
Widowed 24,229 1,873 13,044 14,375 32,388 5,945 13,294 31,185
Divorced 32,790 1,687 10,150 15,039 58,114 8,245 23,290 30,347
Veteran Population Veterans 70,358 5,665 26,923 32,473 83,928 14,560 37,374 60,087
Non-Veterans 246,413 18,064 98,512 123,910 436,056 68,764 185,243 245,155
Veteran Population by War or Conflict Veterans from May 1975 or Later 10,467 326 1,961 3,386 15,270 2,049 5,129 6,322
Vietnam Era 16,445 800 4,821 6,262 23,690 4,279 12,158 12,431
Korean Conflict 8,301 758 2,888 3,887 9,453 1,783 4,041 6,856
World War II 20,618 2,816 12,720 14,030 19,755 4,059 8,087 24,826
World War I 137 0 112 41 98 58 48 306
Multiple Wars 8,515 523 2,162 2,130 7,587 879 3,298 4,103
Other Service 5,875 442 2,259 2,737 8,075 1,453 4,613 5,243
Native-Born Population Total 378,016 26,326 146,809 187,848 626,436 100,071 269,494 349,372
Foreign-Born Population Total 20,962 2,375 5,295 6,985 51,055 7,657 18,035 21,340
Naturalized 11,803 1,577 3,119 4,185 22,480 3,554 8,779 12,076
Non-Citizen 9,159 798 2,176 2,800 28,575 4,103 9,256 9,262
Households by Energy Usage for Heat Gas (Utility, Bottled, Tank, or LP Gas) 28,232 1,127 17,521 23,407 30,664 6,505 12,834 22,707
Electricity 123,633 10,080 42,252 47,220 203,089 30,855 88,181 113,935
Fuel Oil, Kerosene, Etc. 7,230 476 2,713 5,270 18,190 1,165 5,736 14,278
Coal, Coke, and Wood 791 114 846 1,883 1,047 333 491 1,287
Solar Energy 89 17 17 72 60 28 40 102
Other Fuel 159 29 30 91 290 36 40 337
No Fuel 1,231 37 237 234 1,512 228 335 730
Population by Work Transportation Method Car, Truck, or Van 171,569 9,578 52,519 68,824 319,961 48,215 141,039 139,505
Public Transportation 505 25 181 125 7,671 206 740 1,648
Motorcycles 1,309 92 299 331 1,641 235 500 1,373
Bicycles 1,616 79 255 185 2,345 387 709 1,507
Walking 3,564 210 1,662 1,614 15,755 1,043 2,472 4,145
Other Means 931 107 619 618 2,475 503 668 1,282
Working from Home 3,775 293 1,399 1,825 6,423 655 3,805 3,604
Labor
Brevard County Flagler County Lake County Marion County Orange County Osceola County Seminole County Volusia County
Population in Labor Force Total 198,490 11,280 61,591 80,415 381,101 55,154 159,464 165,864
Armed Forces 3,773 20 106 107 12,529 39 717 430
Civilian Work Force 194,717 11,260 61,485 80,308 368,572 55,115 158,747 165,434
Employed 183,692 10,542 57,965 74,958 350,953 52,455 151,377 155,529
Unemployed 11,025 718 3,520 5,350 17,619 2,660 7,370 9,905
Not in Work Force 122,054 12,469 63,950 76,075 151,412 28,209 63,870 139,808
Male Population in Labor Force Total 110,881 6,106 33,653 43,092 209,060 29,754 86,497 89,643
Armed Forces 3,395 9 81 100 10,247 34 594 405
Civilian Work Force 107,486 6,097 33,572 42,992 198,813 29,720 85,903 89,238
Employed 101,530 5,786 31,679 40,226 189,907 28,281 82,157 83,833
Unemployed 5,956 311 1,893 2,766 8,906 1,439 3,746 5,405
Not in Work Force 46,033 5,175 25,774 30,815 52,562 10,539 21,026 56,768
Female Population in Labor Force Total 87,609 5,174 27,938 37,323 172,041 25,400 72,967 76,221
Armed Forces 378 11 25 7 2,282 5 123 25
Civilian Work Force 87,231 5,163 27,913 37,316 169,759 25,395 72,844 76,196
Employed 82,162 4,756 26,286 34,732 161,046 24,174 69,220 71,696
Unemployed 5,069 407 1,627 2,584 8,713 1,221 3,624 4,500
Not in Work Force 76,021 7,294 38,176 45,260 98,850 17,670 42,844 83,040
Employment and Unemployment by Race White Employed 167,811 9,574 51,334 65,887 290,042 47,449 136,251 139,601
White Unemployed 9,129 577 2,680 4,180 12,253 2,174 6,220 7,921
Black Employed 11,740 682 5,499 7,647 42,870 2,487 9,920 11,720
Black Unemployed 1,456 98 738 1,144 4,110 255 783 1,681
American Indian, Eskimo, Aleut Employed 816 72 226 405 1,267 202 569 592
American Indian, Eskimo, Aleut Unemployed 82 0 0 36 103 0 51 40
Asian and Pacific Islander Employed 2,266 131 316 469 7,243 814 2,348 1,103
Asian and Pacific Islander Unemployed 268 21 30 37 323 32 153 81
Other Race Employed 1,059 83 590 550 9,531 1,503 2,019 2,513
Other Race Unemployed 90 22 72 15 830 199 163 182
Hispanic Employed 5,533 433 2,020 2,003 30,876 5,588 8,768 6,479
Hispanic Unemployed 412 63 110 139 2,336 521 761 634
Employment by Industry Agriculture, Forestry, and Fishery 3,437 395 4,054 4,030 7,682 1,252 3,095 5,468
Mining 148 8 170 213 215 24 46 138
Construction 14,823 13,559 5,058 5,691 26,863 4,679 11,660 13,254
Manufacturing Non-Durable Goods 3,381 205 2,581 2,884 10,562 1,139 4,434 4,724
Manufacturing Durable Goods 32,952 1,022 3,392 7,910 24,101 2,703 13,580 12,075
Transportation 6,688 396 2,137 2,172 17,333 2,387 5,398 5,128
Communications and Other Public Utility 3,942 314 2,201 1,883 10,585 1,382 4,897 4,189
Wholesale Trade 5,836 357 2,534 3,894 17,169 1,770 8,848 5,477
Retail Trade 34,686 2,006 11,698 15,125 65,210 11,627 29,513 34,590
Finance, Insurance, and Real Estate 10,033 750 3,403 4,856 25,976 2,581 13,789 10,693
Business and Repair Services 11,175 504 2,313 3,543 22,772 2,346 9,592 7,598
Personal Services 5,918 558 2,831 2,582 22,404 6,111 4,903 7,697
Entertainment and Recreation Services 3,144 261 1,885 1,342 24,292 5,037 4,149 3,213
Professional and Related Services 35,933 2,043 11,256 15,291 63,103 7,482 31,675 33,496
Health Services 12,933 697 4,637 6,160 22,052 2,794 11,317 13,573
Educational Services 10,952 777 3,480 5,230 20,327 2,660 9,709 11,197
Other Professional and Related Services 12,048 569 3,139 3,901 20,724 2,028 10,649 8,726
Public Administration 11,596 364 2,452 3,542 12,686 1,935 5,798 7,789
Employment by Occupation Managerial and Professional Employees 53,807 2,301 11,327 15,627 89,965 10,112 47,570 37,311
Executive, Administrative and Managerial Employees 23,616 1,482 5,606 7,511 46,089 5,418 24,616 18,905
Professional Specialty Employees 30,191 1,119 5,721 8,116 43,876 4,694 22,954 18,405
Technical, Sales, and Administrative Employees 59,003 3,409 18,080 24,321 118,893 16,312 55,707 50,263
Technicians and Related Support Employees 9,879 278 1,705 2,193 11,892 1,283 5,883 5,296
Sales Employees 22,290 1,551 8,259 11,631 47,443 6,841 25,621 21,931
Administrative Support, Including Clerical, Employees 26,834 1,580 8,116 10,497 59,558 8,188 24,203 23,036
Service Employees 25,352 1,478 9,047 10,595 57,969 11,489 17,124 25,978
Private Household Employees 430 55 336 199 1,305 128 406 527
Protective Service Employees 4,209 176 1,170 1,756 6,467 1,193 2,565 3,744
Service, Except Protective and Household, Employees 20,713 1,247 7,541 8,640 50,197 10,168 14,153 21,707
Farming, Forestry, and Fishing Employees 3,369 408 3,534 3,545 6,923 1,348 2,468 4,917
Precision Production, Craft, and Repair Employees 23,485 1,345 7,571 9,686 37,308 6,760 14,791 19,699
Operators, Fabricators, and Laborers 18,676 1,301 8,406 11,184 39,895 6,434 13,717 17,361
Machine Operators, Assemblers, and Inspectors 7,021 519 2,981 4,668 12,224 1,862 4,815 8,428
Transportation and Material Moving Employees 5,735 303 2,945 3,349 14,839 2,524 4,438 5,572
Handlers, Equipment Cleaners, Helpers, and Laborers 5,920 479 2,480 3,167 12,832 2,048 4,464 5,361
Employment by Sector Private Sector, Wage and Salary Workers 135,001 7,742 42,595 54,435 274,595 42,410 116,103 112,473
Public Sector, Wage and Salary Workers 27,172 1,217 6,734 10,447 39,665 5,418 16,738 20,540
Self-Employed Workers 10,897 878 4,636 6,246 18,937 2,679 9,759 12,661
Private Sector, Not-For-Profit, Wage and Salary Workers 9,992 618 3,525 3,430 16,556 1,805 8,077 9,125
Unpaid Family Workers 630 87 474 400 1,200 143 700 730
Document Item Type Metadata
Original Format
1 table
Collection
Citation
U.S. Census Bureau, “U.S. Census for Central Florida, 1990,” RICHES, accessed August 1, 2026, https://richesmi.cah.ucf.edu/omeka/items/show/3845.