U.S. Census for Central Florida, 2000
Dublin Core
Title
U.S. Census for Central Florida, 2000
Alternative Title
Census, 2000
Subject
Census--United States
Orange County (Fla.)
Marion County (Fla.)
Brevard County (Fla.)
St. Lucie County (Fla.)
Seminole County (Fla.)
Volusia County (Fla.)
Flagler County (Fla.)
Lake County (Fla.)
Osceola County (Fla.)
Population--United States
Description
The Twenty-Second United States Census records for Brevard County, Flagler County, Lake County, Marion County, Orange County, Osceola County, Seminole County, and Volusia County, Florida, for 2000. The census divides the population by gender, race ("white alone," "black," "American Indian and Alaska Native," "Asian," Native Hawaiian and Other Pacific Islander," "other race," "two or moreraces," "Hispanic," "Mexican," "Puerto Rican," "Cuban," "Dominican," "Central American," "Costa Rican," "Guatemalan," "Honduran," "Nicaraguan," "Panamanian," "Salvadoran," "Other Central American," "South American," "Argentinean," "Bolivian," "Chilean," "Columbian," "Ecuadorian," "Paraguayan," "Peruvian," "Uruguayan," "Venezuelan," "Other South American," "Spaniard," "Asian Indian," "Bangladeshi," "Cambodian," "Chinese," "Filipino," "Hmong," "Indonesian," "Japanese," "Korean," "Laotian," "Malaysian," "Pakistani,""Sri Lankan," "Taiwanese," "Vietnamese," and "other Asian"), and native-born vs. foreign-born. Those who are foreign born are further divided by country of origin. The census then lists the population categorized by marital status, type of residence, military service, primary and secondary school attendance, and college attendance. The census also collected information on labor, on unemployment, on energy usage, and on transportation.
For the Census of 2000, the short form consisted of only seven questions, while the long form consisted of 52 questions and was used for a 17-percent sample of the population. For the first time, race questions were not limited to a single category; rather, respondents were able to check multiple boxes. A new question related to grandparents as caregivers was also mandated by legislation passed in 1996. Disability questions were expanded to including hearing and vision impairments, as well as learning, memory, and concentration disabilities. The 2000 Census also eliminated questions related to children born, water sources, sewage disposal, and condominium status. In addition, the 2000 Census was the first in which the Internet was used as the principal medium for the dissemination of census information. Summary Files were available for download immediately upon release and individual tables could be viewed via American FactFinder, the Census Bureau's online database. Files were also available for purchase on CD-Rom and DVD.
Due to declining questionnaire mail-back rates, the U.S. Census Bureau marketed a $167 million national and local print, television, and public advertising campaign in 17 different languages. The campaign successfully brought the mail-back rate up to 67 percent. Additionally, respondents receiving the short form were given the option of responding via the Internet. Telephone questionnaire assistance centers available in six languages also took responses via the phone. Statistical sampling techniques were utilized in two ways: first, to alter the traditional 100-percent personal visit of non-responding households during the non-response follow-up (NRFU) process instead by following up on a smaller sample basis; second, the sampling of 750,000 housing units matched to housing unit questionnaires obtained from mail and telephone responses, as well as from personal visits. The goal of the latter was to develop adjustment factors for individuals estimated to have been missed or duplicated and to correct the census counts to produce one set of numbers. This "one-number census" would correct for net coverage errors called Integrated Coverage Measurement (ICM). Both of these measures were taken in an attempt to avoid repetition of the litigation costs generated by the 1980 Census and the 1990 Census.
Despite these efforts, two lawsuits—one filed by the U.S. House of Representatives—were filed in February 1998 challenging the constitutionality and legality of the planned uses of sampling to produce apportionment counts. Both cases were decided in favor of the plaintiffs in federal district courts, but the U.S. Department of Commerce made appeals to the U.S. Supreme Court. Known as the U.S. Department of Commerce v. the U.S. House of Representatives, the Court ruled that the Census Bureau's plans to use statistical sampling for purposes of congressional apportionments violated the Census Act. The bureau revised its plan, stating that it would produce statistically adjusted data for non-apportionment uses of census data information, such as redistricting. However, in March of 2001, the Census Bureau recommended against the use of adjusted census data for redistricting due to accuracy concerns; the Secretary of Commerce determined that the unadjusted data would be released as the bureau's official redistricting data. The Director of the Census Bureau also rejected to the use of adjusted data for non-redistricting purposes in October of that same year.
Creator
Source
Original census data collected by the U.S. Census Bureau, 2000.
Publisher
Date Created
ca. 2000-04-01
Contributor
Gibson, Ella
Is Format Of
Digital reproduction of original census data collected by the U.S. Census Bureau, 2000.
Is Part Of
U.S. Census Collection, RICHES of Central Florida.
Format
image/jpg
Extent
3.12 MB
Medium
1 table
Language
eng
Type
Dataset
Coverage
Brevard County, Florida
Flagler County, Florida
Lake County, Florida
Marion County, Florida
Orange County, Florida
Osceola County, Florida
Seminole County, Florida
Volusia County, Florida
Accrual Method
Item Creation
Mediator
History Teacher
Economics Teacher
Civics/Government Teacher
Geography Teacher
Provenance
Originally collected by the U.S. Census Bureau and published by the U.S. Department of Commerce.
Rights Holder
This resource is not subject to copyright in the United States and there are no copyright restrictions on reproduction, derivative works, distribution, performance, or display of the work. Anyone may, without restriction under U.S. copyright laws:
- reproduce the work in print or digital form
- create derivative works
- perform the work publicly
- display the work
- distribute copies or digitally transfer the work to the public by sale or other transfer of ownership, or by rental, lease, or lending.
Curator
Cepero, Laura
Digital Collection
External Reference
"2000 Overview." U.S. Census Bureau. https://www.census.gov/history/www/through_the_decades/overview/2000.html.
United States, and Carroll D. Wright. The History and Growth of the United States Census. Washington: U.S. Government Printing Office, 1970. https://www.census.gov/history/pdf/wright-hunt.pdf.
U.S. Bureau of the Census. History: 2000 Census of Population and Housing, Volume 1. Washington: U.S. Government Printing Office, 1966. https://www.census.gov/history/pdf/Census2000v1.pdf.
U.S. Bureau of the Census. History: 2000 Census of Population and Housing, Volume 2. Washington: U.S. Government Printing Office, 1966. https://www.census.gov/history/pdf/Census2000v2.pdf.
Transcript
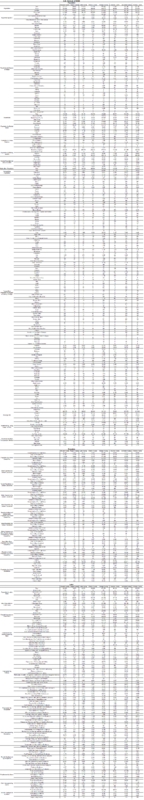
U.S. Census of 2000
Population
Brevard County Flagler County Lake County Marion County Orange County Osceola County Seminole County Volusia County
Population Total 476,230 49,832 210,528 258,916 896,344 172,493 365,196 443,343
Males 233,186 23,887 101,866 124,945 443,716 85,022 178,776 215,361
Females 243,044 25,945 108,662 133,971 452,628 87,471 186,420 227,982
Population by Race White Alone 413,411 43,490 184,138 217,909 614,830 133,169 300,948 381,760
Black 40,000 4,401 17,503 29,900 162,899 12,702 34,764 41,198
American Indian and Alaska Native 1,765 133 701 1,158 3,079 790 1,087 1,373
Asian 7,152 583 1,667 1,806 30,033 3,802 9,115 4,430
Native Hawaiian and Other Pacific Islander 305 12 76 57 843 142 163 164
Other Race 5,168 480 3,966 4,363 53,889 15,631 11,175 8,071
Two or More Races 8,429 733 2,477 3,723 30,771 6,257 7,944 6,347
Population by Descent or Origin Hispanic 21,970 2,537 11,808 15,616 168,361 50,727 40,731 29,111
Mexican 3,281 237 5,638 3,350 19,755 3,400 3,871 7,733
Puerto Rican 9,111 1,031 2,978 6,997 86,583 30,728 19,609 13,546
Cuban 2,161 292 638 1,049 12,371 2,178 3,610 1,570
Dominican 458 37 102 257 6,358 2,313 1,223 452
Central American 1,296 101 372 561 5,703 1,870 1,595 789
Costa Rican 150 5 39 45 600 188 233 122
Guatemalan 323 23 75 122 949 241 165 83
Honduran 210 15 71 87 1,223 266 212 138
Nicaraguan 93 6 34 78 716 315 220 100
Panamanian 392 34 75 152 1,037 251 402 173
Salvadorian 91 11 58 62 883 521 265 134
Other Central American 37 7 20 15 295 88 98 39
South American 1,690 340 559 1,013 15,436 4,254 4,690 1,541
Argentinean 136 26 32 29 794 217 370 132
Bolivian 26 7 2 1 191 34 83 22
Chilean 116 7 24 33 451 130 114 101
Colombian 661 149 235 520 7,676 2,071 2,182 592
Ecuadorian 156 28 60 181 1,687 474 484 210
Paraguayan 15 0 1 1 25 4 8 7
Peruvian 217 54 114 96 1,629 470 648 141
Uruguayan 15 33 8 8 115 42 41 49
Venezuelan 256 21 60 95 2,315 686 587 190
Other South American 92 15 23 49 553 126 173 97
Other Hispanic 3,973 499 1,521 2,389 22,155 5,984 6,133 3,480
Spaniard 262 37 52 50 599 129 218 147
Spanish 784 88 267 333 1,968 415 759 556
Spanish American 90 4 36 69 329 78 104 63
Other Hispanic or Latino 2,837 370 1,166 1,937 19,259 5,362 5,052 2,714
Asian Indian 1,806 69 562 715 8,166 1,230 2,994 1,345
Bangladeshi 15 0 11 0 101 33 33 14
Cambodian 48 13 9 1 141 6 33 19
Chinese, Except Taiwanese 951 82 217 160 4,227 569 1,428 661
Filipino 1,577 292 332 313 5,066 951 1,281 798
Hmong 0 0 2 0 2 0 10 0
Indonesian 32 2 3 4 71 9 30 25
Japanese 531 16 84 129 1,193 92 307 256
Korean 631 37 153 209 1,950 141 1,094 445
Laotian 20 1 11 1 232 25 154 120
Malaysian 9 0 0 1 33 2 10 7
Pakistani 52 1 13 17 732 245 171 76
Sri Lankan 2 0 3 1 56 14 8 28
Taiwanese 72 11 2 13 226 45 65 21
Thai 351 10 47 26 436 85 123 79
Vietnamese 763 24 174 130 6,189 184 1,074 329
Other Asian 23 0 4 1 58 3 9 4
Other Asian, Not Specified 166 10 19 72 577 90 161 130
Households Total 198,195 21,294 88,413 106,755 336,286 60,977 139,572 184,723
Family Households 132,480 15,683 62,468 74,637 220,258 45,077 97,249 120,064
Married Couple Family 104,964 13,378 52,105 59,339 157,937 34,207 75,718 93,161
Other Family 27,516 2,305 10,363 15,298 62,321 10,870 21,531 26,903
Non- Family 65,715 5,611 25,945 32,118 116,028 15,900 42,323 64,659
Population by Marital Status Never Married 78,006 5,869 27,762 37,350 214,910 32,173 71,780 78,186
Married 224,987 28,530 110,140 127,501 355,270 75,570 162,707 205,036
Separated 7,403 553 2,689 4,160 19,485 3,577 5,162 6,690
Widowed 31,880 3,799 17,018 19,631 36,918 7,860 15,876 34,496
Divorced 47,747 3,707 17,129 24,635 79,329 14,725 32,730 45,397
Population in Group Quarters Total 9,695 462 3,767 6,881 18,831 2,400 3,606 14,737
Institutionalized 6,303 428 3,071 5,644 11,987 1,921 2,260 7,391
Correctional Institutions 2,431 55 1,522 3,780 6,307 903 1,216 2,616
Nursing Homes 2,543 342 1,425 1,579 3,684 862 994 3,931
Other Institutions 1,329 31 124 285 1,996 156 50 844
Non-Institutionalized 3,392 34 696 1,237 6,844 479 1,346 7,346
College Dormitories 1,088 0 0 231 3,402 155 12 4,530
Military Quarters 215 0 0 0 0 0 0 5
Other, Non-Institutionalized 2,089 34 696 1,006 3,442 324 1,334 2,811
Not in Group Quarters 466,535 49,370 206,761 252,035 877,513 170,093 361,590 428,606
Population by Military Service Active Armed Forces 2,318 19 129 113 413 76 198 255
Veterans 79,145 9,252 35,534 43,300 84,940 17,226 39,515 66,646
Non-Veterans 290,433 31,631 132,175 160,233 585,412 108,979 233,200 286,986
Veteran Population by War or Conflict Gulf War 6,733 444 1,748 2,324 11,262 1,975 4,764 4,137
Vietnam Era 19,233 1,769 6,720 8,584 23,668 4,829 12,294 15,369
Korean Conflict 10,541 1,739 6,225 7,318 8,673 1,903 4,025 10,017
World War II 15,312 2,797 10,930 12,695 11,921 2,722 5,281 18,058
Multiple Wars 7,086 469 2,240 2,301 4,506 595 2,142 3,455
Other Service 20,240 2,034 7,671 10,078 24,910 5,202 11,009 15,610
Native-Born Population Total 445,229 44,875 199,708 245,564 767,440 148,383 331,911 414,990
Foreign-Born Population Total 31,001 4,957 10,820 13,352 128,904 24,110 33,285 28,353
Naturalized 18,374 3,354 5,084 7,516 53,651 9,514 16,507 14,955
Non-Citizen 12,627 1,603 5,736 5,836 75,253 14,596 16,778 13,398
Foreign-Born Population by Region or Country of Origin Europe 9,881 2,267 2,779 3,458 13,547 3,790 6,769 9,808
Northern Europe 3,374 561 1,091 1,060 4,471 1,560 2,414 2,883
United Kingdom 2,595 413 820 875 3,519 1,388 1,891 2,217
Ireland 317 74 105 79 432 70 214 297
Sweden 172 31 59 26 135 34 115 151
Other Northern Europe 290 43 107 80 385 68 194 218
Western Europe 3,480 585 1,167 1,394 3,827 805 1,735 3,281
Austria 76 21 36 52 112 23 113 164
France 509 17 193 56 754 43 118 293
Germany 2,298 440 867 1,137 2,378 617 1,185 2,407
Netherlands 305 77 20 96 280 71 162 252
Other Western Europe 292 30 51 53 303 51 157 165
Southern Europe 1,616 523 205 477 2,044 457 1,218 1,603
Greece 239 16 21 52 255 25 144 379
Italy 961 230 143 329 1,080 207 706 975
Portugal 132 178 10 41 235 120 108 92
Spain 227 77 31 51 459 89 237 129
Other Southern Europe 57 22 0 4 15 16 23 28
Eastern Europe 1,400 598 316 527 3,195 959 1,402 2,031
Czechoslovakia, Including Czech Republic and Slovakia 128 29 48 48 208 275 129 242
Hungary 166 15 50 144 306 110 217 303
Poland 469 179 101 168 366 169 204 501
Romania 143 15 16 28 252 19 134 101
Belarus 2 0 0 0 16 0 8 18
Russia 166 148 42 10 430 298 116 180
Ukraine 50 187 19 23 259 50 26 147
Bosnia and Herzegovina 0 0 0 0 451 0 214 7
Yugoslavia 62 14 12 41 126 5 128 131
Other Eastern Europe 214 11 28 65 781 33 226 401
Europe, Not Elsewhere Classified 11 0 0 0 10 9 0 10
Asia 6,529 570 1,209 1,704 23,739 3,187 7,205 4,426
Eastern Asia 1,584 36 307 459 5,728 636 1,947 1,224
China 640 16 133 152 2,843 496 852 494
China, Excluding Hong Kong and Taiwan 361 9 75 99 1,635 218 589 267
Hong Kong 57 7 29 19 460 93 64 146
Taiwan 222 0 29 34 748 185 199 81
Japan 410 9 96 133 1,069 52 279 321
Korea 534 11 71 174 1,757 88 801 409
Other Eastern Asia 0 0 7 0 59 0 15 0
South Central Asia 1,558 108 336 501 5,754 1,270 2,060 1,179
Afghanistan 0 0 0 0 1 0 8 31
Bangladesh 12 0 0 8 361 120 15 90
India 1,261 43 273 392 3,298 424 1,268 735
Iran 151 38 39 52 562 25 429 202
Pakistan 126 26 16 18 1,426 574 299 58
Other South Central Asia 8 1 8 31 106 127 41 63
South Eastern Asia 2,426 380 479 581 10,114 1,063 2,339 1,347
Cambodia 54 37 0 9 146 12 13 13
Indonesia 129 19 18 83 88 13 57 57
Laos 0 0 52 5 77 102 194 37
Malaysia 52 6 13 24 140 16 29 58
Philippines 1,177 225 246 200 3,418 647 1,060 783
Thailand 398 18 28 30 452 63 151 128
Vietnam 616 75 121 195 5,730 203 814 271
Other South Eastern Asia 0 0 1 35 63 7 21 0
Western Asia 924 46 78 145 1,774 165 816 610
Iraq 39 0 0 0 61 0 58 12
Israel 29 0 31 12 238 49 163 64
Jordan 33 0 5 27 165 50 77 120
Lebanon 266 0 26 70 437 13 254 85
Syria 24 0 0 5 222 20 104 25
Turkey 122 46 16 7 170 6 87 109
Armenia 6 0 0 7 0 0 0 9
Other Western Asia 405 0 0 17 481 27 73 186
Asia, Not Elsewhere Classified 37 0 9 18 369 53 43 66
Africa 1,088 58 253 251 3,710 804 1,344 828
Eastern Africa 161 8 18 93 820 45 479 183
Ethiopia 14 8 0 11 123 0 0 20
Other Eastern Africa 147 0 18 82 697 45 479 163
Middle Africa 20 0 0 0 98 0 0 36
Northern Africa 474 50 122 9 1,338 519 409 353
Egypt 263 31 80 9 358 42 304 195
Other Northern Africa 211 19 42 0 980 477 105 158
Southern Africa 228 0 15 43 549 30 204 103
South Africa 200 0 15 43 549 30 204 103
Other Southern Africa 28 0 0 0 0 0 0 0
Western Africa 163 0 28 91 561 185 225 108
Ghana 16 0 9 0 69 8 94 15
Nigeria 121 0 19 91 308 6 81 48
Sierra Leone 0 0 0 0 19 0 0 0
Other Western Africa 26 0 0 0 165 171 50 45
Africa, Not Elsewhere Classified 42 0 70 15 344 25 27 45
Oceania 140 78 36 95 313 38 129 138
Australia and New Zealand Subregion 104 78 36 73 188 23 108 124
Australia 78 21 36 64 142 13 70 109
Other Australian and New Zealand Subregion 26 57 0 9 46 10 38 15
Melanesia 0 0 0 16 17 15 0 0
Micronesia 16 0 0 6 59 0 0 14
Polynesia 20 0 0 0 49 0 15 0
Oceania, Not Elsewhere Classified 0 0 0 0 0 0 6 0
Americas 13,363 1,984 6,543 7,827 87,595 16,291 17,838 13,153
Latin America 10,644 1,762 5,479 6,469 83,648 15,648 15,711 10,093
Caribbean 5,495 974 1,322 2,559 41,956 6,227 6,632 3,287
Barbados 153 33 19 62 589 141 88 28
Cuba 970 159 424 554 8,809 1,251 2,094 875
Dominican Republic 331 58 128 210 5,153 2,080 931 446
Haiti 213 33 167 143 13,227 569 718 268
Jamaica 2,414 437 375 1,198 8,756 1,248 1,684 790
Trinidad and Tobago 693 180 119 222 2,663 457 586 493
Other Caribbean 721 74 90 170 2,759 481 531 387
Central America 2,553 203 3,396 2,172 16,926 3,549 3,387 4,556
Mexico 1,028 34 2,846 1,597 11,100 1,626 1,364 3,663
Other Central America 1,525 169 550 575 5,826 1,923 2,023 893
Costa Rica 206 0 0 35 506 133 340 172
El Salvador 180 11 91 66 826 572 404 161
Guatemala 355 16 162 112 1,114 172 280 106
Honduras 236 18 116 151 1,457 290 336 141
Nicaragua 94 8 32 70 708 414 155 87
Panama 454 95 137 133 1,066 310 385 199
Other Central America 0 21 12 8 149 32 123 27
South America 2,596 585 761 1,738 24,766 5,872 5,692 2,250
Argentina 255 57 18 0 853 177 417 159
Bolivia 3 0 0 0 442 7 30 7
Brazil 352 25 39 98 4,765 835 435 307
Chile 144 40 30 13 562 184 178 93
Colombia 744 193 211 819 8,550 2,156 2,306 761
Ecuador 121 30 99 270 1,885 607 403 209
Guyana 397 102 113 282 2,741 291 538 185
Peru 226 20 102 142 1,707 574 725 163
Venezuela 299 20 119 80 2,826 878 518 259
Other South America 55 98 30 34 435 163 142 107
Northern America 2,719 222 1,064 1,358 3,947 643 2,127 3,060
Canada 2,682 220 1,055 1,338 3,900 643 2,085 3,030
Other Northern America 37 2 9 20 47 0 42 30
Born at Sea 0 0 0 17 0 0 0 0
Housing Units Total 222,072 24,452 102,830 122,663 361,349 72,293 147,079 211,938
Occupied 198,195 21,294 88,413 106,755 336,286 60,977 139,572 184,723
Vacant 23,877 3,158 14,417 15,908 25,063 11,316 7,507 27,215
For Rent 5,970 358 2,158 2,341 10,116 2,429 2,819 4,039
For Sale 3,477 370 1,886 2,331 3,619 958 1,319 2,864
Households by Energy Usage for Heat Gas (Utility, Bottled, Tank, or LP Gas) 30,291 645 15,796 19,235 26,907 5,163 12,114 16,924
Electricity 163,791 20,322 70,732 83,373 299,899 54,547 124,260 159,179
Fuel Oil, Kerosene, Etc. 2,073 169 882 2,380 6,047 365 2,233 6,144
Coal, Coke, and Wood 336 36 387 843 506 101 203 660
Solar Energy 39 0 3 0 43 24 57 79
Other Fuel 105 33 130 112 243 33 50 256
No Fuel 1,560 89 483 812 2,641 744 655 1,481
Population by Work Transportation Method Car, Truck, or Van 192,896 17,168 76,050 90,409 404,604 73,183 174,772 171,448
Public Transportation 591 130 348 217 10,923 825 1,227 1,914
Motorcycles 765 76 217 159 853 281 534 981
Bicycles 1,278 78 248 313 2,038 386 660 1,033
Walking 2,653 221 1,129 1,369 6,085 1,054 1,898 3,531
Other Means 1,390 151 838 818 3,642 624 1,317 1,582
Working from Home 5,506 625 2,633 3,019 11,178 1,510 7,186 5,426
Education
Brevard County Flagler County Lake County Marion County Orange County Osceola County Seminole County Volusia County
Population by School Completion Completing Less Than High School 46,416 5,453 31,482 40,813 104,591 23,095 27,523 56,982
High School Completed 98,108 12,330 53,339 67,271 148,006 37,536 59,280 102,353
Some College Completed 115,194 12,642 44,940 53,477 171,495 32,560 80,922 101,929
Bachelor's Degree 51,616 5,170 17,509 16,126 104,818 12,052 51,235 36,646
Master's Degree 20,995 2,023 5,458 5,966 29,990 3,610 16,882 12,536
Professional School 4,889 722 2,056 2,638 10,945 1,393 5,472 4,785
Doctorate Degree 2,520 276 788 896 4,256 361 1,902 1,994
Male Population by School Completion Completing Less Than High School 21,055 2,682 15,185 20,255 50,528 11,453 12,856 27,650
High School Completed 42,196 5,366 23,137 29,860 67,485 17,246 25,644 46,259
Some College Completed 53,613 5,775 21,256 24,683 81,995 15,676 36,647 46,461
Bachelor's Degree 28,222 2,753 9,236 7,952 53,117 6,076 27,227 18,609
Master's Degree 12,251 997 2,942 2,950 15,844 1,661 8,764 6,326
Professional School 3,216 459 1,254 1,626 6,803 725 3,674 3,072
Doctorate Degree 1,751 189 579 674 2,822 204 1,369 1,385
Female Population by School Completion Completing Less Than High School 25,361 2,771 16,297 20,558 54,063 11,642 14,667 29,332
High School Completed 55,912 6,964 30,202 37,411 80,521 20,290 33,636 56,094
Some College Completed 61,581 6,867 23,684 28,794 89,500 16,884 44,275 55,468
Bachelor's Degree 23,394 2,417 8,273 8,174 51,701 5,976 24,008 18,037
Master's Degree 8,744 1,026 2,516 3,016 14,146 1,949 8,118 6,210
Professional School 1,673 263 802 1,012 4,142 668 1,798 1,713
Doctorate Degree 769 87 209 222 1,434 157 533 609
White Population by School Completion Completing Less Than High School 37,567 4,500 25,766 33,247 60,146 17,355 19,218 47,006
High School Completed 265,645 29,645 115,146 130,473 358,068 71,834 186,568 236,703
Some College Completed 177,263 18,296 66,168 70,187 250,401 40,341 136,300 143,048
Bachelor's Degree 73,746 7,262 24,294 22,835 121,362 14,077 66,382 50,651
Graduate or Professional School 26,151 2,599 7,793 8,503 36,549 4,353 20,807 17,596
Black Population by School Completion Completing Less Than High School 6,222 612 3,791 5,330 27,290 1,928 5,406 6,694
High School Completed 15,871 2,365 5,630 11,463 61,429 5,240 14,425 15,128
Some College Completed 9,416 1,661 2,351 6,135 36,623 2,845 9,327 9,047
Bachelor's Degree 2,667 564 692 1,768 13,058 828 3,660 3,207
Graduate or Professional School 747 259 267 638 3,681 272 1,397 1,049
American Indian and Alaska Native Population by School Completion Completing Less Than High School 314 12 154 201 461 109 164 191
High School Completed 1,160 87 317 612 1,503 193 842 871
Some College Completed 725 80 145 456 853 106 612 624
Bachelor's Degree 152 26 8 134 284 19 268 180
Graduate or Professional School 38 26 0 31 116 0 99 73
Asian Population by School Completion Completing Less Than High School 904 61 202 336 3,867 394 638 532
High School Completed 4,249 345 798 1,149 15,500 2,031 5,225 2,711
Some College Completed 3,235 267 649 808 12,144 1,610 4,258 2,044
Bachelor's Degree 1,946 151 338 513 7,945 997 2,838 1,190
Graduate or Professional School 947 58 80 190 2,684 256 1,189 408
Native Hawaiian and Other Pacific Islander Population by School Completion Completing Less Than High School 24 0 9 10 84 34 0 23
High School Completed 134 0 0 28 327 46 101 57
Some College Completed 81 0 0 28 230 31 40 42
Bachelor's Degree 21 0 0 19 76 5 0 0
Graduate or Professional School 12 0 0 14 25 0 0 0
Some Other Race Population by School Completion Completing Less Than High School 500 143 1,091 1,177 8,193 2,388 1,318 1,630
High School Completed 2,225 258 978 1,147 19,255 5,492 4,552 2,055
Some College Completed 1,666 166 635 646 12,161 3,369 3,005 1,321
Bachelor's Degree 478 70 249 97 3,700 894 1,082 330
Graduate or Professional School 164 19 64 27 985 310 279 88
Hispanic or Latino Population by School Completion Aged 25+ 12,809 1,767 6,248 8,790 95,505 28,364 24,165 16,659
Completing Less Than High School 2,540 461 2,705 3,460 27,742 8,247 5,071 6,202
High School Completed 10,269 1,306 3,543 5,330 67,763 20,117 19,094 10,457
Some College Completed 7,396 741 2,326 3,228 44,475 11,928 13,519 6,860
Bachelor's Degree 2,935 302 907 831 16,194 3,552 5,625 1,954
Graduate or Professional School 972 163 277 374 5,099 939 1,915 658
Population by School Enrollment Enrolled 112,005 9,366 40,624 54,173 248,040 44,944 99,337 101,190
Not Enrolled 349,620 39,284 163,384 197,003 611,968 120,923 252,611 329,318
Public School 91,848 8,149 34,908 46,347 204,974 38,926 80,854 79,381
Public Pre-School 3,521 324 1,400 1,882 7,437 1,321 2,503 2,905
Public K-8 49,627 4,380 19,813 26,299 102,097 22,395 42,047 42,065
Public High School 21,896 2,024 9,201 11,584 45,485 10,211 18,665 19,215
Public College 16,804 1,421 4,494 6,582 49,955 4,999 17,639 15,196
Private School 20,157 1,217 5,716 7,826 43,066 6,018 18,483 21,809
Private Pre-School 3,885 376 1,353 1,592 9,371 1,284 4,830 3,730
Private K-8 7,203 360 2,720 3,620 15,393 2,146 7,126 5,258
Private High School 1,996 118 633 1,118 4,102 495 2,071 1,655
Private College 7,073 363 1,010 1,496 14,200 2,093 4,456 11,166
Labor
Brevard County Flagler County Lake County Marion County Orange County Osceola County Seminole County Volusia County
Population in Labor Force Total 220,413 19,670 86,307 104,422 471,974 84,142 198,464 201,913
Armed Forces 2,318 19 129 113 413 76 198 255
Civilian Labor Force 218,095 19,651 86,178 104,309 471,561 84,066 198,266 201,658
Employed 207,366 18,815 82,819 98,248 447,861 79,859 190,973 189,035
Unemployed 10,729 836 3,359 6,061 23,700 4,207 7,293 12,623
Not in Labor Force 163,663 22,200 85,967 105,310 221,452 47,135 84,636 162,621
Male Population in Labor Force Total 119,342 10,349 46,312 54,645 251,471 44,428 106,283 107,321
Armed Forces 2,048 10 109 109 375 58 178 206
Civilian Labor Force 117,294 10,339 46,203 54,536 251,096 44,370 106,105 107,115
Employed 111,595 9,889 44,453 51,569 239,431 42,204 102,411 100,145
Unemployed 5,699 450 1,750 2,967 11,665 2,166 3,694 6,970
Not in Labor Force 66,680 9,544 36,010 44,657 87,278 19,206 30,039 67,395
Female Population in Labor Force Total 101,071 9,321 39,995 49,777 220,503 39,714 92,181 94,592
Armed Forces 270 9 20 4 38 18 20 49
Civilian Labor Force 100,801 9,312 39,975 49,773 220,465 39,696 92,161 94,543
Employed 95,771 8,926 38,366 46,679 208,430 37,655 88,562 88,890
Unemployed 5,030 386 1,609 3,094 12,035 2,041 3,599 5,653
Not in Labor Force 96,983 12,656 49,957 60,653 134,174 27,929 54,597 95,226
Employment and Unemployment by Race White Employed 182,829 16,701 72,821 84,361 324,773 63,838 161,737 164,827
White Unemployed 8,644 722 2,596 4,543 13,878 3,045 5,384 9,831
Black or African American Employed 14,154 1,364 5,894 9,629 67,034 5,376 14,393 15,240
Black or African American Unemployed 1,445 92 520 1,155 5,956 454 1,089 2,144
American Indian and Alaska Native Employed 1,044 60 356 496 1,478 222 826 765
American Indian and Alaska Native Unemployed 81 0 29 62 119 30 46 77
Asian Employed 3,329 220 728 962 14,961 1,702 4,757 2,131
Asian Unemployed 205 14 25 16 675 107 169 88
Native Hawaiian and Other Pacific Islander Employed 142 0 12 14 355 63 68 97
Native Hawaiian and Other Pacific Islander Unemployed 9 0 0 0 22 0 0 8
Some Other Race Employed 2,289 267 1,901 1,694 24,246 5,983 5,163 3,364
Some Other Race Unemployed 152 6 126 171 1,939 465 289 228
Hispanic or Latino Employed 9,415 873 5,232 5,816 73,233 20,739 19,335 11,101
Hispanic or Latino Unemployed 622 29 334 590 5,428 1,477 1,123 1,797
Employment by Industry Agriculture, Forestry, Fishing and Hunting, and Mining 1,042 241 2,311 3,432 2,369 482 621 2,075
Agriculture, Forestry, and Fishing and Hunting 887 223 2,132 3,266 2,257 434 584 2,058
Mining 155 18 179 166 112 48 37 17
Construction 16,424 1,873 8,556 8,803 33,618 7,030 15,439 16,827
Manufacturing 28,223 1,875 5,264 10,416 28,548 4,325 15,131 16,297
Wholesale Trade 5,177 439 3,399 3,117 17,584 2,559 8,255 5,606
Retail Trade 27,766 3,046 11,145 15,499 54,069 10,596 26,089 26,243
Transportation, Warehousing, and Utilities 8,434 813 4,043 4,789 24,799 4,689 8,412 8,310
Transportation and Warehousing 7,176 611 3,229 3,714 21,872 4,084 7,030 6,655
Utilities 1,258 202 814 1,075 2,927 605 1,382 1,655
Information 6,541 412 2,347 1,892 17,174 1,229 8,357 5,339
Finance, Insurance, Real Estate, and Rental and Leasing 10,828 1,151 4,901 5,100 34,668 4,409 18,231 11,886
Finance and Insurance 5,875 579 2,982 2,896 20,344 1,720 12,994 6,701
Real Estate and Rental and Leasing 4,953 572 1,919 2,204 14,324 2,689 5,237 5,185
Professional, Scientific, Management, Administrative, and Waste Management Services 21,876 1,633 6,716 7,712 51,511 5,497 25,213 17,342
Professional, Scientific, and Technical Services 13,377 823 2,754 3,488 29,078 2,113 16,195 8,448
Management of Companies and Enterprise 57 0 5 24 210 7 80 18
Administrative, Support, and Waste Management Services 8,442 810 3,957 4,200 22,223 3,377 8,938 8,876
Educational, Health, and Social Services 36,027 3,497 14,135 19,167 64,356 9,802 32,953 37,004
Educational Services 13,513 1,634 5,099 7,275 27,559 4,522 14,673 15,296
Health Care and Social Assistance 22,514 1,863 9,036 11,892 36,797 5,280 18,280 21,708
Arts, Entertainment, Recreation, Accommodation, and Food Services 20,476 2,124 11,273 8,440 82,026 23,687 16,862 22,680
Arts, Entertainment, and Recreation 4,542 466 5,154 1,940 31,553 8,907 4,969 4,891
Accommodation and Food Services 15,934 1,658 6,119 6,500 50,473 14,780 11,893 17,789
Other Services, Except Public Administration 9,517 836 4,416 5,305 21,953 3,088 8,218 10,088
Public Administration 15,035 875 4,313 4,576 15,186 2,466 7,192 9,338
Employment by Occupation Management, Business, and Financial Operations Employees 25,257 2,385 10,256 10,089 63,728 8,262 31,322 21,985
Professional and Related Employees 47,217 3,121 13,456 15,821 81,543 10,119 42,507 32,511
Health Care Support Employees 4,085 407 1,996 2,333 5,904 1,160 2,658 4,085
Protective Service Employees 4,921 494 2,225 2,313 8,794 1,852 3,507 4,497
Food Preparation and Serving Related Employees 11,930 1,272 4,274 5,089 30,987 7,844 8,461 12,263
Building, Grounds Cleaning, and Maintenance Employees 7,971 914 4,061 3,995 18,641 5,343 5,128 8,353
Personal Care and Service Employees 5,303 501 2,649 3,458 15,855 2,814 4,895 4,980
Sales and Related Employees 25,845 2,447 10,301 13,270 58,829 10,614 29,534 24,853
Office and Administrative Support Employees 29,940 2,962 12,118 14,457 74,240 12,573 30,850 29,414
Farming, Fishing, and Forestry Employees 642 65 1,540 1,297 1,808 239 314 1,562
Construction, Extraction, and Maintenance Employees 21,793 2,175 10,229 11,851 40,021 9,616 16,353 22,216
Production Employees 12,388 1,242 3,985 7,344 20,704 3,753 7,463 11,721
Transportation and Material Moving Employees 10,074 830 5,729 6,931 26,807 5,670 7,981 10,595
Male Employment by Occupation Management, Business, and Financial Operations Employees 14,925 1,448 6,088 5,838 35,997 4,460 18,881 12,645
Professional and Related Employees 24,396 1,279 5,224 5,957 38,302 4,211 20,386 13,322
Health Care Support Employees 456 51 192 297 843 109 284 453
Protective Service Employees 3,998 414 1,895 1,818 6,603 1,454 2,818 3,558
Food Preparation and Serving Related Employees 4,759 516 1,686 1,611 16,146 3,765 4,144 5,303
Building, Grounds Cleaning, and Maintenance Employees 4,818 633 2,734 2,432 10,339 2,741 3,417 5,346
Personal Care and Service Employees 1,197 147 738 1,088 5,860 975 1,418 1,306
Sales and Related Employees 11,874 1,099 5,047 6,147 29,017 4,668 16,138 11,841
Office and Administrative Support Employees 7,137 672 2,652 3,079 20,733 3,287 7,376 7,067
Farming, Fishing, and Forestry Employees 544 38 999 1,012 1,083 160 212 1,017
Construction, Extraction, and Maintenance Employees 20,941 2,043 9,759 11,359 38,404 9,055 15,590 21,334
Production Employees 7,991 878 2,776 5,006 13,455 2,513 4,841 7,752
Transportation and Material Moving Employees 8,559 671 4,663 5,925 22,649 4,806 6,906 9,201
Female Employment by Occupation Management, Business, and Financial Operations Employees 10,332 937 4,168 4,251 27,731 3,802 12,441 9,340
Professional and Related Employees 22,821 1,842 8,232 9,864 43,241 5,908 22,121 19,189
Health Care Support Employees 3,629 356 1,804 2,036 5,061 1,051 2,374 3,632
Protective Service Employees 923 80 330 495 2,191 398 689 939
Food Preparation and Serving Related Employees 7,171 756 2,588 3,478 14,841 4,079 4,317 6,960
Building, Grounds Cleaning, and Maintenance Employees 3,153 281 1,327 1,563 8,302 2,602 1,711 3,007
Personal Care and Service Employees 4,106 354 1,911 2,370 9,995 1,839 3,477 3,674
Sales and Related Employees 13,971 1,348 5,254 7,123 29,812 5,946 13,396 13,012
Office and Administrative Support Employees 22,803 2,290 9,466 11,378 53,507 9,286 23,474 22,347
Farming, Fishing, and Forestry Employees 98 27 541 285 725 79 102 545
Construction, Extraction, and Maintenance Employees 852 132 470 492 1,617 561 763 882
Production Employees 4,397 364 1,209 2,338 7,249 1,240 2,622 3,969
Transportation and Material Moving Employees 1,515 159 1,066 1,006 4,158 864 1,075 1,394
Employment by Sector Private Sector Employees 140,975 12,217 57,209 67,011 336,958 62,521 135,938 127,632
Public Sector Employees 31,971 2,806 10,183 13,194 47,342 7,878 21,726 25,132
Self-Employed Employees 21,305 2,634 10,119 12,153 37,746 6,330 21,673 22,679
Non-Profit Employees 12,549 1,098 4,964 5,510 24,923 2,983 11,169 13,052
Unpaid Family Workers 566 60 344 380 892 147 467 540
Male Employment by Sector Private Sector Employees 77,045 6,502 31,252 36,394 184,769 33,504 74,886 68,711
Public Sector Employees 16,669 1,214 4,841 5,436 20,573 3,474 9,221 11,784
Self-Employed Employees 13,933 1,867 6,565 7,979 25,601 4,277 14,931 14,977
Non-Profit Employees 3,748 277 1,621 1,605 8,051 898 3,160 4,432
Unpaid Family Workers 200 29 174 155 437 51 213 241
Female Employment by Sector Private Sector Employees 63,930 5,715 25,957 30,617 152,189 29,017 61,052 58,921
Public Sector Employees 15,302 1,592 5,342 7,758 26,769 4,404 12,505 13,348
Self-Employed Employees 7,372 767 3,554 4,174 12,145 2,053 6,742 7,702
Non-Profit Employees 8,801 821 3,343 3,905 16,872 2,085 8,009 8,620
Unpaid Family Workers 366 31 170 225 455 96 254 299
Document Item Type Metadata
Original Format
1 table
Collection
Citation
U.S. Census Bureau, “U.S. Census for Central Florida, 2000,” RICHES, accessed July 28, 2026, https://richesmi.cah.ucf.edu/omeka/items/show/3846.