U.S. Census for Central Florida, 1930
Dublin Core
Title
U.S. Census for Central Florida, 1930
Alternative Title
Census, 1930
Subject
Census--United States
Orange County (Fla.)
Marion County (Fla.)
Brevard County (Fla.)
St. Lucie County (Fla.)
Seminole County (Fla.)
Volusia County (Fla.)
Flagler County (Fla.)
Lake County (Fla.)
Osceola County (Fla.)
Population--United States
Description
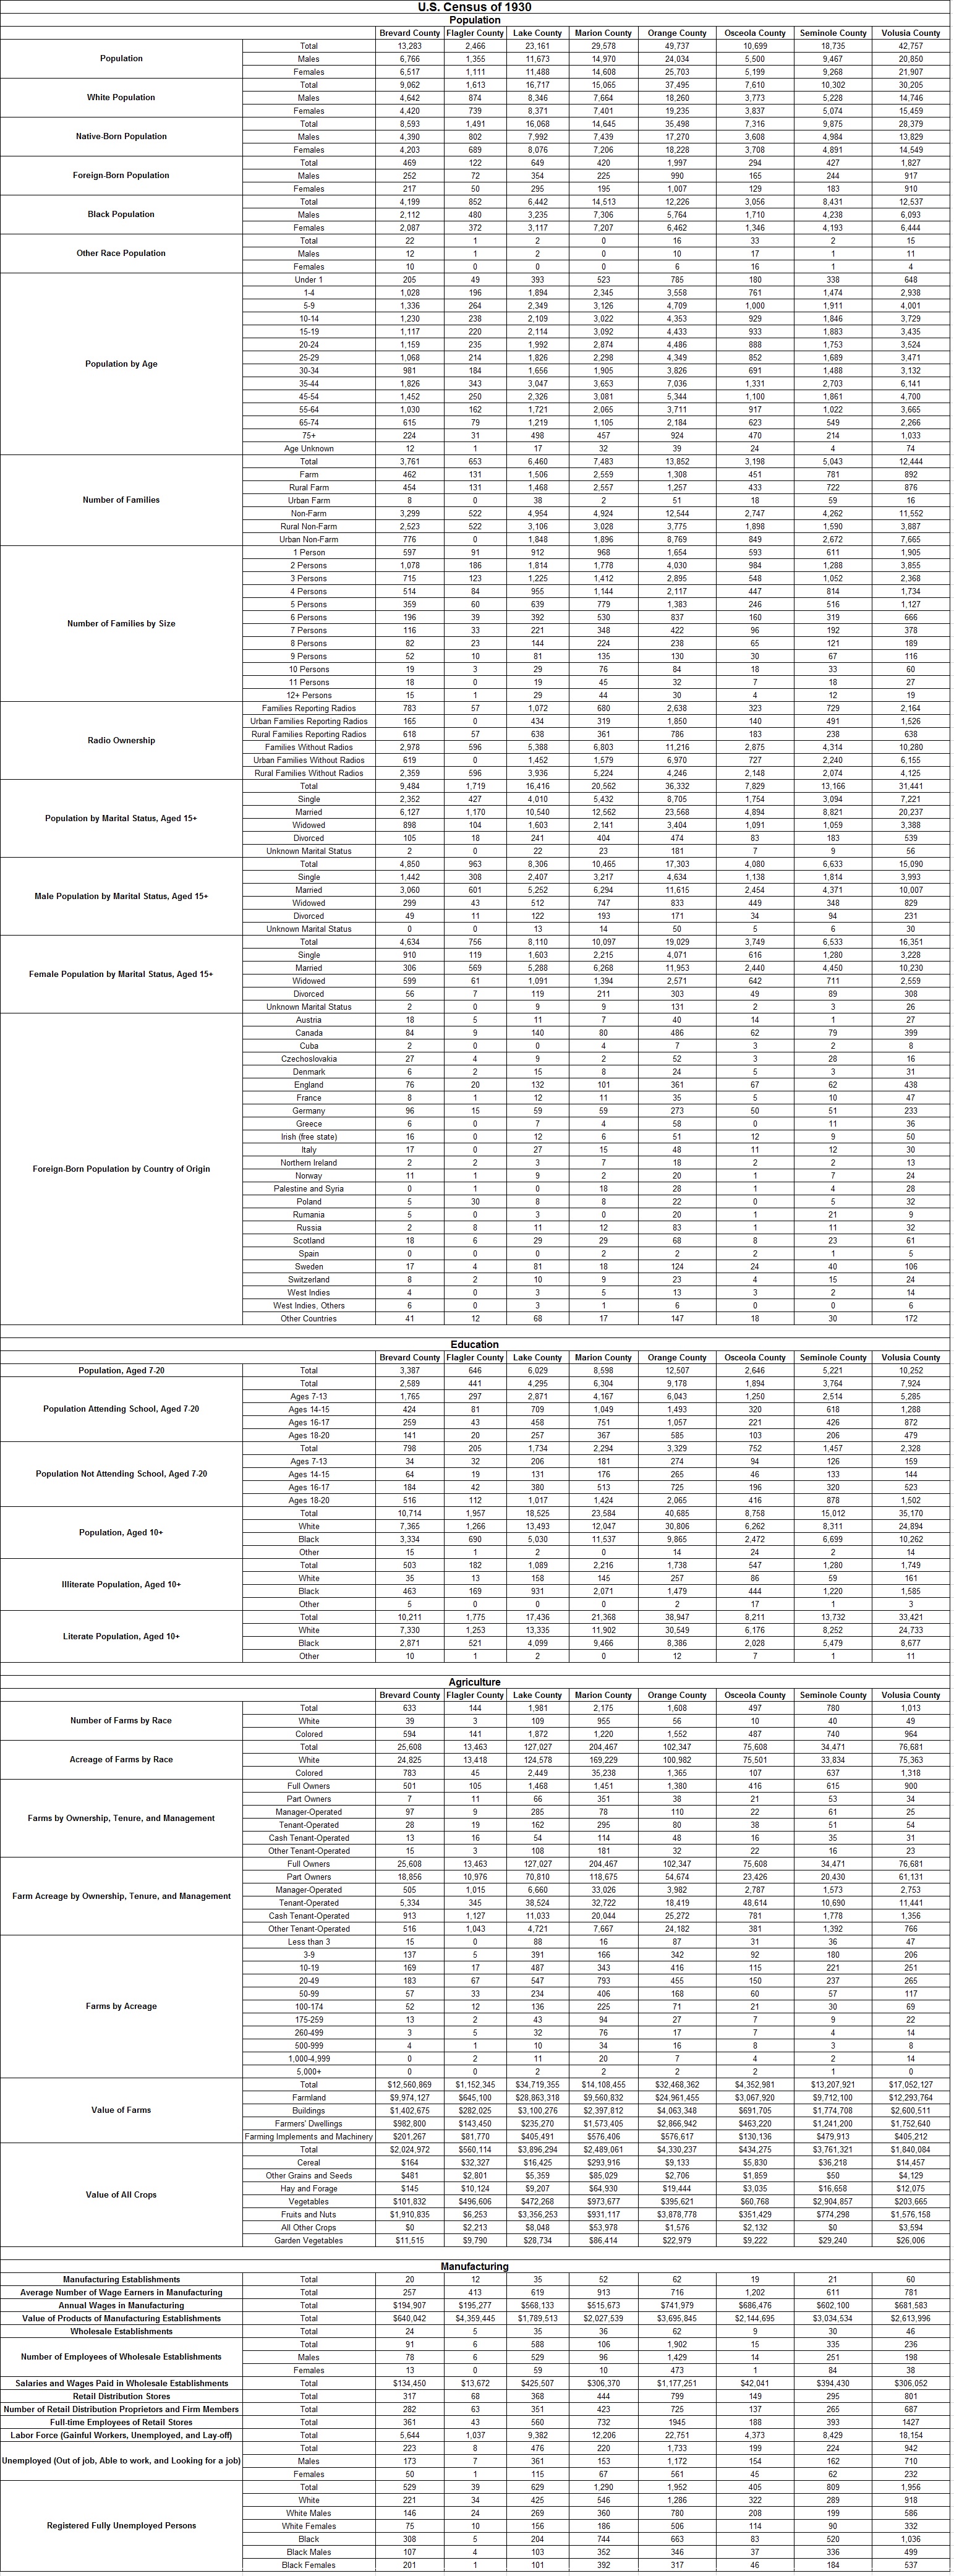
The Fifteenth United States Census records for Brevard County, Flagler County, Lake County, Marion County, Orange County, Osceola County, Seminole County, and Volusia County, Florida, for 1930. The census divides the population by gender, race ("white" and "black"), and native-born vs. foreign-born. Those who are foreign born are further divided by country of origin. The census then lists the population categorized by age, family size (as well as rural families vs. urban families), family radio ownership, marital status, school attendance, and literacy. The census also collected information on agriculture, on manufacturing, and on unemployment.
The act authorizing the 1930 Census was approved on June 18, 1929, allowing for censuses of population, agriculture, irrigation, draining, distribution, unemployment, and mining. For the first time, specific questions for inquiry were left to the discretion of the Director of the Census. The Census encompassed each state, as well as the District of Columbia, Alaska, Hawaii, and Puerto Rico. The Governors of Guam, American Samoa, the Virginia Islands, and the Panama Canal Zone were responsible for conducting censuses in their respective territories. Between the date that the census act was passed and Census Day (April 1st), the stock market crashed, plunging the entire country into the Great Depression. In response, there were public and academic requests for access to unemployment data collected in the 1930 Census; however, the U.S. Census Bureau was unable to meet this demand and the bureau was accused of presenting unreliable data. Congress required a special unemployment census for January 1931, which ultimately confirmed the severity of the economic crisis. Another unemployment census was conducted in 1937, as mandated by Congress. Because this special census was voluntary, it allowed the Census Bureau to experiment with statistical sampling. Only two percent of households received a special census questionnaire.
The act authorizing the 1930 Census was approved on June 18, 1929, allowing for censuses of population, agriculture, irrigation, draining, distribution, unemployment, and mining. For the first time, specific questions for inquiry were left to the discretion of the Director of the Census. The Census encompassed each state, as well as the District of Columbia, Alaska, Hawaii, and Puerto Rico. The Governors of Guam, American Samoa, the Virginia Islands, and the Panama Canal Zone were responsible for conducting censuses in their respective territories. Between the date that the census act was passed and Census Day (April 1st), the stock market crashed, plunging the entire country into the Great Depression. In response, there were public and academic requests for access to unemployment data collected in the 1930 Census; however, the U.S. Census Bureau was unable to meet this demand and the bureau was accused of presenting unreliable data. Congress required a special unemployment census for January 1931, which ultimately confirmed the severity of the economic crisis. Another unemployment census was conducted in 1937, as mandated by Congress. Because this special census was voluntary, it allowed the Census Bureau to experiment with statistical sampling. Only two percent of households received a special census questionnaire.
Creator
Source
Original census data collected by the U.S. Census Bureau, 1930.
Publisher
Date Created
ca. 1930-04-01
Contributor
Gibson, Ella
Is Format Of
Digital reproduction of original census data collected by the U.S. Census Bureau, 1930.
Is Part Of
U.S. Census Collection, RICHES of Central Florida.
Format
image/jpg
Extent
1.99 MB
Medium
1 table
Language
eng
Type
Dataset
Coverage
Brevard County, Florida
Flagler County, Florida
Lake County, Florida
Marion County, Florida
Orange County, Florida
Osceola County, Florida
Seminole County, Florida
Volusia County, Florida
Accrual Method
Item Creation
Mediator
History Teacher
Economics Teacher
Geography Teacher
Provenance
Originally collected by the U.S. Census Bureau and published by the U.S. Department of Commerce.
Rights Holder
This resource is not subject to copyright in the United States and there are no copyright restrictions on reproduction, derivative works, distribution, performance, or display of the work. Anyone may, without restriction under U.S. copyright laws:
- reproduce the work in print or digital form;
- create derivative works;
- perform the work publicly;
- display the work;
- distribute copies or digitally transfer the work to the public by sale or other transfer of ownership, or by rental, lease, or lending.
Curator
Cepero, Laura
Digital Collection
External Reference
"1930 Overview." U.S. Census Bureau. https://www.census.gov/history/www/through_the_decades/overview/1930.html.
United States. Historical Statistics of the United States: Colonial Times to 1970. Washington: U.S. Dept. of Commerce, Bureau of the Census, 1975. https://www.census.gov/history/pdf/histstats-colonial-1970.pdf.
United States, and Carroll D. Wright. The History and Growth of the United States Census. Washington: U.S. Government Printing Office, 1930. https://www.census.gov/history/pdf/wright-hunt.pdf.
Transcript
U.S. Census of 1930
Population
Brevard County Flagler County Lake County Marion County Orange County Osceola County Seminole County Volusia County
Population Total 13,283 2,466 23,161 29,578 49,737 10,699 18,735 42,757
Males 6,766 1,355 11,673 14,970 24,034 5,500 9,467 20,850
Females 6,517 1,111 11,488 14,608 25,703 5,199 9,268 21,907
White Population Total 9,062 1,613 16,717 15,065 37,495 7,610 10,302 30,205
Males 4,642 874 8,346 7,664 18,260 3,773 5,228 14,746
Females 4,420 739 8,371 7,401 19,235 3,837 5,074 15,459
Native-Born Population Total 8,593 1,491 16,068 14,645 35,498 7,316 9,875 28,379
Males 4,390 802 7,992 7,439 17,270 3,608 4,984 13,829
Females 4,203 689 8,076 7,206 18,228 3,708 4,891 14,549
Foreign-Born Population Total 469 122 649 420 1,997 294 427 1,827
Males 252 72 354 225 990 165 244 917
Females 217 50 295 195 1,007 129 183 910
Black Population Total 4,199 852 6,442 14,513 12,226 3,056 8,431 12,537
Males 2,112 480 3,235 7,306 5,764 1,710 4,238 6,093
Females 2,087 372 3,117 7,207 6,462 1,346 4,193 6,444
Other Race Population Total 22 1 2 0 16 33 2 15
Males 12 1 2 0 10 17 1 11
Females 10 0 0 0 6 16 1 4
Population by Age Under 1 205 49 393 523 785 180 338 648
1-4 1,028 196 1,894 2,345 3,558 761 1,474 2,938
5-9 1,336 264 2,349 3,126 4,709 1,000 1,911 4,001
10-14 1,230 238 2,109 3,022 4,353 929 1,846 3,729
15-19 1,117 220 2,114 3,092 4,433 933 1,883 3,435
20-24 1,159 235 1,992 2,874 4,486 888 1,753 3,524
25-29 1,068 214 1,826 2,298 4,349 852 1,689 3,471
30-34 981 184 1,656 1,905 3,826 691 1,488 3,132
35-44 1,826 343 3,047 3,653 7,036 1,331 2,703 6,141
45-54 1,452 250 2,326 3,081 5,344 1,100 1,861 4,700
55-64 1,030 162 1,721 2,065 3,711 917 1,022 3,665
65-74 615 79 1,219 1,105 2,184 623 549 2,266
75+ 224 31 498 457 924 470 214 1,033
Age Unknown 12 1 17 32 39 24 4 74
Number of Families Total 3,761 653 6,460 7,483 13,852 3,198 5,043 12,444
Farm 462 131 1,506 2,559 1,308 451 781 892
Rural Farm 454 131 1,468 2,557 1,257 433 722 876
Urban Farm 8 0 38 2 51 18 59 16
Non-Farm 3,299 522 4,954 4,924 12,544 2,747 4,262 11,552
Rural Non-Farm 2,523 522 3,106 3,028 3,775 1,898 1,590 3,887
Urban Non-Farm 776 0 1,848 1,896 8,769 849 2,672 7,665
Number of Families by Size 1 Person 597 91 912 968 1,654 593 611 1,905
2 Persons 1,078 186 1,814 1,778 4,030 984 1,288 3,855
3 Persons 715 123 1,225 1,412 2,895 548 1,052 2,368
4 Persons 514 84 955 1,144 2,117 447 814 1,734
5 Persons 359 60 639 779 1,383 246 516 1,127
6 Persons 196 39 392 530 837 160 319 666
7 Persons 116 33 221 348 422 96 192 378
8 Persons 82 23 144 224 238 65 121 189
9 Persons 52 10 81 135 130 30 67 116
10 Persons 19 3 29 76 84 18 33 60
11 Persons 18 0 19 45 32 7 18 27
12+ Persons 15 1 29 44 30 4 12 19
Radio Ownership Families Reporting Radios 783 57 1,072 680 2,638 323 729 2,164
Urban Families Reporting Radios 165 0 434 319 1,850 140 491 1,526
Rural Families Reporting Radios 618 57 638 361 786 183 238 638
Families Without Radios 2,978 596 5,388 6,803 11,216 2,875 4,314 10,280
Urban Families Without Radios 619 0 1,452 1,579 6,970 727 2,240 6,155
Rural Families Without Radios 2,359 596 3,936 5,224 4,246 2,148 2,074 4,125
Population by Marital Status, Aged 15+ Total 9,484 1,719 16,416 20,562 36,332 7,829 13,166 31,441
Single 2,352 427 4,010 5,432 8,705 1,754 3,094 7,221
Married 6,127 1,170 10,540 12,562 23,568 4,894 8,821 20,237
Widowed 898 104 1,603 2,141 3,404 1,091 1,059 3,388
Divorced 105 18 241 404 474 83 183 539
Unknown Marital Status 2 0 22 23 181 7 9 56
Male Population by Marital Status, Aged 15+ Total 4,850 963 8,306 10,465 17,303 4,080 6,633 15,090
Single 1,442 308 2,407 3,217 4,634 1,138 1,814 3,993
Married 3,060 601 5,252 6,294 11,615 2,454 4,371 10,007
Widowed 299 43 512 747 833 449 348 829
Divorced 49 11 122 193 171 34 94 231
Unknown Marital Status 0 0 13 14 50 5 6 30
Female Population by Marital Status, Aged 15+ Total 4,634 756 8,110 10,097 19,029 3,749 6,533 16,351
Single 910 119 1,603 2,215 4,071 616 1,280 3,228
Married 306 569 5,288 6,268 11,953 2,440 4,450 10,230
Widowed 599 61 1,091 1,394 2,571 642 711 2,559
Divorced 56 7 119 211 303 49 89 308
Unknown Marital Status 2 0 9 9 131 2 3 26
Foreign-Born Population by Country of Origin Austria 18 5 11 7 40 14 1 27
Canada 84 9 140 80 486 62 79 399
Cuba 2 0 0 4 7 3 2 8
Czechoslovakia 27 4 9 2 52 3 28 16
Denmark 6 2 15 8 24 5 3 31
England 76 20 132 101 361 67 62 438
France 8 1 12 11 35 5 10 47
Germany 96 15 59 59 273 50 51 233
Greece 6 0 7 4 58 0 11 36
Irish (free state) 16 0 12 6 51 12 9 50
Italy 17 0 27 15 48 11 12 30
Northern Ireland 2 2 3 7 18 2 2 13
Norway 11 1 9 2 20 1 7 24
Palestine and Syria 0 1 0 18 28 1 4 28
Poland 5 30 8 8 22 0 5 32
Rumania 5 0 3 0 20 1 21 9
Russia 2 8 11 12 83 1 11 32
Scotland 18 6 29 29 68 8 23 61
Spain 0 0 0 2 2 2 1 5
Sweden 17 4 81 18 124 24 40 106
Switzerland 8 2 10 9 23 4 15 24
West Indies 4 0 3 5 13 3 2 14
West Indies, Others 6 0 3 1 6 0 0 6
Other Countries 41 12 68 17 147 18 30 172
Education
Brevard County Flagler County Lake County Marion County Orange County Osceola County Seminole County Volusia County
Population, Aged 7-20 Total 3,387 646 6,029 8,598 12,507 2,646 5,221 10,252
Population Attending School, Aged 7-20 Total 2,589 441 4,295 6,304 9,178 1,894 3,764 7,924
Ages 7-13 1,765 297 2,871 4,167 6,043 1,250 2,514 5,285
Ages 14-15 424 81 709 1,049 1,493 320 618 1,288
Ages 16-17 259 43 458 751 1,057 221 426 872
Ages 18-20 141 20 257 367 585 103 206 479
Population Not Attending School, Aged 7-20 Total 798 205 1,734 2,294 3,329 752 1,457 2,328
Ages 7-13 34 32 206 181 274 94 126 159
Ages 14-15 64 19 131 176 265 46 133 144
Ages 16-17 184 42 380 513 725 196 320 523
Ages 18-20 516 112 1,017 1,424 2,065 416 878 1,502
Population, Aged 10+ Total 10,714 1,957 18,525 23,584 40,685 8,758 15,012 35,170
White 7,365 1,266 13,493 12,047 30,806 6,262 8,311 24,894
Black 3,334 690 5,030 11,537 9,865 2,472 6,699 10,262
Other 15 1 2 0 14 24 2 14
Illiterate Population, Aged 10+ Total 503 182 1,089 2,216 1,738 547 1,280 1,749
White 35 13 158 145 257 86 59 161
Black 463 169 931 2,071 1,479 444 1,220 1,585
Other 5 0 0 0 2 17 1 3
Literate Population, Aged 10+ Total 10,211 1,775 17,436 21,368 38,947 8,211 13,732 33,421
White 7,330 1,253 13,335 11,902 30,549 6,176 8,252 24,733
Black 2,871 521 4,099 9,466 8,386 2,028 5,479 8,677
Other 10 1 2 0 12 7 1 11
Agriculture
Brevard County Flagler County Lake County Marion County Orange County Osceola County Seminole County Volusia County
Number of Farms by Race Total 633 144 1,981 2,175 1,608 497 780 1,013
White 39 3 109 955 56 10 40 49
Colored 594 141 1,872 1,220 1,552 487 740 964
Acreage of Farms by Race Total 25,608 13,463 127,027 204,467 102,347 75,608 34,471 76,681
White 24,825 13,418 124,578 169,229 100,982 75,501 33,834 75,363
Colored 783 45 2,449 35,238 1,365 107 637 1,318
Farms by Ownership, Tenure, and Management Full Owners 501 105 1,468 1,451 1,380 416 615 900
Part Owners 7 11 66 351 38 21 53 34
Manager-Operated 97 9 285 78 110 22 61 25
Tenant-Operated 28 19 162 295 80 38 51 54
Cash Tenant-Operated 13 16 54 114 48 16 35 31
Other Tenant-Operated 15 3 108 181 32 22 16 23
Farm Acreage by Ownership, Tenure, and Management Full Owners 25,608 13,463 127,027 204,467 102,347 75,608 34,471 76,681
Part Owners 18,856 10,976 70,810 118,675 54,674 23,426 20,430 61,131
Manager-Operated 505 1,015 6,660 33,026 3,982 2,787 1,573 2,753
Tenant-Operated 5,334 345 38,524 32,722 18,419 48,614 10,690 11,441
Cash Tenant-Operated 913 1,127 11,033 20,044 25,272 781 1,778 1,356
Other Tenant-Operated 516 1,043 4,721 7,667 24,182 381 1,392 766
Farms by Acreage Less than 3 15 0 88 16 87 31 36 47
3-9 137 5 391 166 342 92 180 206
10-19 169 17 487 343 416 115 221 251
20-49 183 67 547 793 455 150 237 265
50-99 57 33 234 406 168 60 57 117
100-174 52 12 136 225 71 21 30 69
175-259 13 2 43 94 27 7 9 22
260-499 3 5 32 76 17 7 4 14
500-999 4 1 10 34 16 8 3 8
1,000-4,999 0 2 11 20 7 4 2 14
5,000+ 0 0 2 2 2 2 1 0
Value of Farms Total $12,560,869 $1,152,345 $34,719,355 $14,108,455 $32,468,362 $4,352,981 $13,207,921 $17,052,127
Farmland $9,974,127 $645,100 $28,863,318 $9,560,832 $24,961,455 $3,067,920 $9,712,100 $12,293,764
Buildings $1,402,675 $282,025 $3,100,276 $2,397,812 $4,063,348 $691,705 $1,774,708 $2,600,511
Farmers' Dwellings $982,800 $143,450 $235,270 $1,573,405 $2,866,942 $463,220 $1,241,200 $1,752,640
Farming Implements and Machinery $201,267 $81,770 $405,491 $576,406 $576,617 $130,136 $479,913 $405,212
Value of All Crops Total $2,024,972 $560,114 $3,896,294 $2,489,061 $4,330,237 $434,275 $3,761,321 $1,840,084
Cereal $164 $32,327 $16,425 $293,916 $9,133 $5,830 $36,218 $14,457
Other Grains and Seeds $481 $2,801 $5,359 $85,029 $2,706 $1,859 $50 $4,129
Hay and Forage $145 $10,124 $9,207 $64,930 $19,444 $3,035 $16,658 $12,075
Vegetables $101,832 $496,606 $472,268 $973,677 $395,621 $60,768 $2,904,857 $203,665
Fruits and Nuts $1,910,835 $6,253 $3,356,253 $931,117 $3,878,778 $351,429 $774,298 $1,576,158
All Other Crops $0 $2,213 $8,048 $53,978 $1,576 $2,132 $0 $3,594
Garden Vegetables $11,515 $9,790 $28,734 $86,414 $22,979 $9,222 $29,240 $26,006
Manufacturing
Manufacturing Establishments Total 20 12 35 52 62 19 21 60
Average Number of Wage Earners in Manufacturing Total 257 413 619 913 716 1,202 611 781
Annual Wages in Manufacturing Total $194,907 $195,277 $568,133 $515,673 $741,979 $686,476 $602,100 $681,583
Value of Products of Manufacturing Establishments Total $640,042 $4,359,445 $1,789,513 $2,027,539 $3,695,845 $2,144,695 $3,034,534 $2,613,996
Wholesale Establishments Total 24 5 35 36 62 9 30 46
Number of Employees of Wholesale Establishments Total 91 6 588 106 1,902 15 335 236
Males 78 6 529 96 1,429 14 251 198
Females 13 0 59 10 473 1 84 38
Salaries and Wages Paid in Wholesale Establishments Total $134,450 $13,672 $425,507 $306,370 $1,177,251 $42,041 $394,430 $306,052
Retail Distribution Stores Total 317 68 368 444 799 149 295 801
Number of Retail Distribution Proprietors and Firm Members Total 282 63 351 423 725 137 265 687
Full-time Employees of Retail Stores Total 361 43 560 732 1945 188 393 1427
Labor Force (Gainful Workers, Unemployed, and Lay-off) Total 5,644 1,037 9,382 12,206 22,751 4,373 8,429 18,154
Unemployed (Out of job, Able to work, and Looking for a job) Total 223 8 476 220 1,733 199 224 942
Males 173 7 361 153 1,172 154 162 710
Females 50 1 115 67 561 45 62 232
Registered Fully Unemployed Persons Total 529 39 629 1,290 1,952 405 809 1,956
White 221 34 425 546 1,286 322 289 918
White Males 146 24 269 360 780 208 199 586
White Females 75 10 156 186 506 114 90 332
Black 308 5 204 744 663 83 520 1,036
Black Males 107 4 103 352 346 37 336 499
Black Females 201 1 101 392 317 46 184 537
Document Item Type Metadata
Original Format
1 table
Collection
Citation
U.S. Census Bureau, “U.S. Census for Central Florida, 1930,” RICHES, accessed August 1, 2026, https://richesmi.cah.ucf.edu/omeka/items/show/3839.